This tutorial will teach you how to build a Flask app that combined with JSON and the Google Charts API. If you have no experience with Flask before I recommend reading my previous tutorials, they are great fun!
To display awesome charts we first need some data. There are two common ways to get data in web apps: data from servers using an API (usually JSON) and data from databases. I use the Fixer.io JSON API to get some financial data, but any JSON API should do. If you are unfamiliar with JSON, see this article.
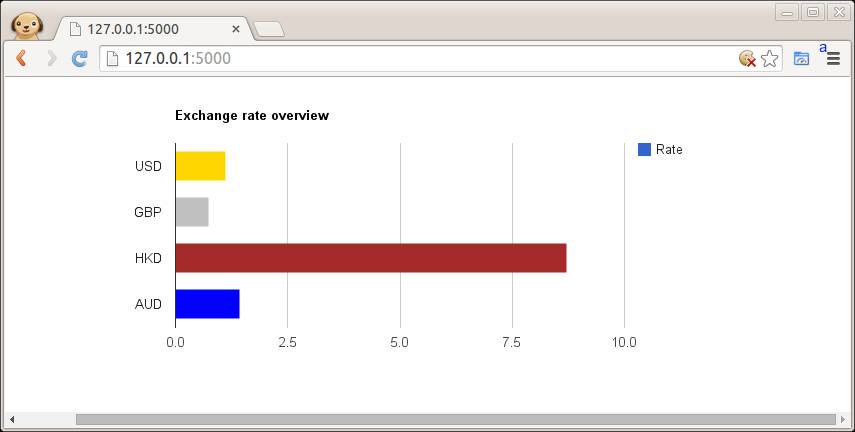
With the Google Charts API you can display live data on your site. There are a lot of great charts there that are easy to add to your Flask app. We simply give the data that we got from the server through JSON and parsed, to the Google Charts API.
Create a flask app with the directory /templates/ for your templates. This is the main Flask code:
from flask import Flask, flash, redirect, render_template, request, session, abort import os import json import urllib2
This is an exceptional tutorial on this!!! Simple yet full of great stuff and tied together well (this has been missing from the web). Nicely done and thanks.
Frank•Fri, 22 May 2015
Thanks!
Abay Bektursun•Mon, 08 Jun 2015
Thank you very much! Well written article!
Ben•Fri, 15 Jan 2016
Perfect! Thank you!
Admpecam•Fri, 05 Aug 2016
Thanks. The article is really helpful. I just have a quick question: In what format the data is in the link in : response = urllib2.urlopen('http://api.fixer.io/latest'). I am in the process of using google annotation chart using flask. So was really curious how to get the data, as I am storing data in mongodb? Thanks
Frank•Fri, 05 Aug 2016
Hi Adm, this format is json. You can load the data with json.loads(json_data) and access it as json object.
Example of using the json object:
import json
array = '{"base":"EUR","date":"2016-08-05","rates":{"AUD":1.4567}}'
data = json.loads(array)
print(data["base"])
print(data["rates"]["AUD"])

 Flask App
Leave a Reply:
This is an exceptional tutorial on this!!! Simple yet full of great stuff and tied together well (this has been missing from the web). Nicely done and thanks.
Thanks!
Thank you very much! Well written article!
Perfect! Thank you!
Thanks. The article is really helpful. I just have a quick question: In what format the data is in the link in : response = urllib2.urlopen('http://api.fixer.io/latest').
I am in the process of using google annotation chart using flask. So was really curious how to get the data, as I am storing data in mongodb? Thanks
Hi Adm, this format is json. You can load the data with json.loads(json_data) and access it as json object.
Example of using the json object:
Thank you so much!