
image histogram
Python hosting: Host, run, and code Python in the cloud!
Image histograms provide a visual representation of the distribution of pixel intensities in an image. Understanding these distributions can be crucial in various computer vision applications. In this guide, we’ll walk you through generating histograms using OpenCV, a prominent library in the computer vision domain.
A histogram is essentially a data structure that counts the frequency of data points categorized into a range of values, known as bins. When referring to images, these data points are pixel values. OpenCV provides robust functions to generate histograms for both color and grayscale images.
For those interested in advancing their skills in this area, there’s a related course that delves deeper into mastering computer vision with OpenCV.
Histogram for Color Images
When dealing with color images, it’s common to generate histograms for each of the primary color channels: blue, green, and red. While there are other tools like matplotlib that can generate histograms, in this article, we’ll focus on using the cv2 module from OpenCV.
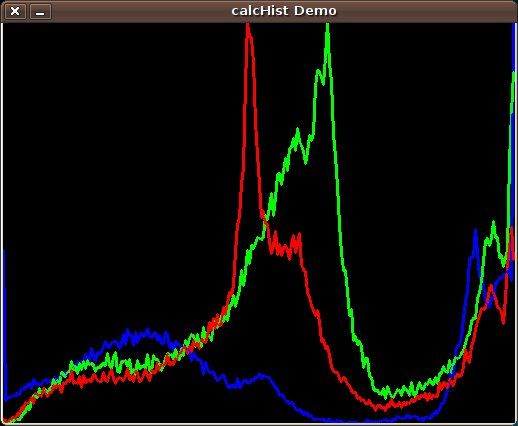
To generate the histogram, the function cv.CalcHist is commonly used. Here’s a quick overview of its parameters:
- image: The source image (uint8 or float32 format). It should be encapsulated within brackets.
- channel: Specifies the color channel. For grayscale images, you’d use [0]. Color images typically have blue, green, and red channels.
- mask: Use
Noneif you want a histogram for the entire image. Otherwise, you can specify a region. - histSize: Determines the number of bins for the histogram.
- range: Refers to the color range.
Here’s a practical example to visualize a histogram for a color image using Python:
1 | import cv2 |
If you’re keen on diving deeper into computer vision with OpenCV, consider checking out the Master Computer Vision with OpenCV course.
Ready for more? Navigate to the previous topic or jump ahead to the next topic.
Leave a Reply: