
Tag: pandas
Pandas Data Structures
pandas filter
pandas groupby
DataFrames data can be summarized using the groupby() method. In this article we’ll give you an example of how to use the groupby method.
This tutorial assumes you have some basic experience with Python pandas, including data frames, series and so on. If you are new to Pandas, I recommend taking the course below.
Related course:
Data Analysis with Python and Pandas: Go from zero to hero
What does groupby do?
The idea of groupby() is pretty simple: create groups of categories and apply a function to them. Groupby has a process of splitting, applying and combining data.
- splitting: the data is split into groups
- applying: a function is applied to each group
- combining: the results (data of different datasets is combined after applying groupby, resulting in a new data structure)
If you programmed databases (SQL) before, you may be familiar with a query like this:
SELECT city, count(name) |
Pandas groupby does a similar thing. But then you’d type
print(df1.groupby(["City"])[['Name']].count()) |
Installing pandas
If you don’t have the pandas data analysis module installed, you can run the commands:
$ python -m venv pandas-example |
This sets up a virtual environment and install the pandas module inside it.
Pandas groupby example
Start by importing pandas, numpy and creating a data frame.
import pandas as pd |
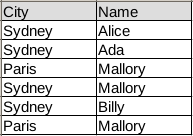
Our data frame contains simple tabular data:
In code the same table is:
|
You can then summarize the data using the groupby method. In our example there are two columns: Name and City.
The function .groupby() takes a column as parameter, the column you want to group on.
Then define the column(s) on which you want to do the aggregation.
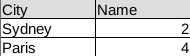
print df1.groupby(["City"])[['Name']].count() |
This will count the frequency of each city and return a new data frame:
The total code being:
|
Example 2
The groupby() operation can be applied to any pandas data frame.
Lets do some quick examples.
The data frame below defines a list of animals and their speed measurements.df = pd.DataFrame({'Animal': ['Elephant','Cat','Cat','Horse','Horse','Cheetah', 'Cheetah'], 'Speed': [20,30,27,50,45,70,66]})
df
Animal Speed
0 Elephant 20
1 Cat 30
2 Horse 50
3 Cheetah 70
You can group by animal and the average speed.
df.groupby(['Animal']).mean() |
If you have multiple columns in your table like so:
df = pd.DataFrame({'Animal': ['Elephant','Cat','Cat','Horse','Horse','Cheetah', 'Cheetah'], |
Then you can add the column like this:
df.groupby("Animal")["Speed"].mean() |
Example 3: Real World Data
The Iris flower data set contains data on several flower species and their measurements. You can load it the whole data set from a csv file like this:
iris = pd.read_csv('https://raw.githubusercontent.com/mwaskom/seaborn-data/master/iris.csv') |
You can read any csv file with the .read_csv() function like this, directly from the web.
To give you some insight into the dataset data:
sepal_length sepal_width petal_length petal_width species |
You can retrieve the same with:
iris.head() |
You can easily retrieve the minimum and maximum of a column
iris['sepal_width'].min() |
You’ve seen the basic groupby before. You can apply groupby while finding the average sepal width.
This then returns the average sepal width for each species.
iris.groupby("species")["sepal_width"].mean() |
If you want the minimum value for each sepal width and species, you’d use:
iris.groupby("species")["sepal_width"].min() |
Conclusion
We’ve covered the groupby() function extensively. You can now apply the function to any data frame, regardless of wheter its a toy dataset or a real world dataset.
You’ve learned:
- how to load a real world data set in Pandas (from the web)
- how to apply the groupby function to that real world data.
If you are interested in learning more about Pandas, check out this course:
Data Analysis with Python and Pandas: Go from zero to hero
pandas read xls
You can use pandas to read data from an Excel file into a DataFrame, and then work with the data just like you would any other dataset.
To read an Excel file into a DataFrame using pandas, you can use the read_excel() function. The read_excel() function returns a DataFrame by default, so you can access the data in your DataFrame using standard indexing and slicing operations.
Pandas, a data analysis library, has native support for loading excel data (xls and xlsx). The method read_excel loads xls data into a Pandas dataframe:
|
If you have a large excel file you may want to specify the sheet:
|
Related course
Data Analysis with Python Pandas
Read excel with Pandas
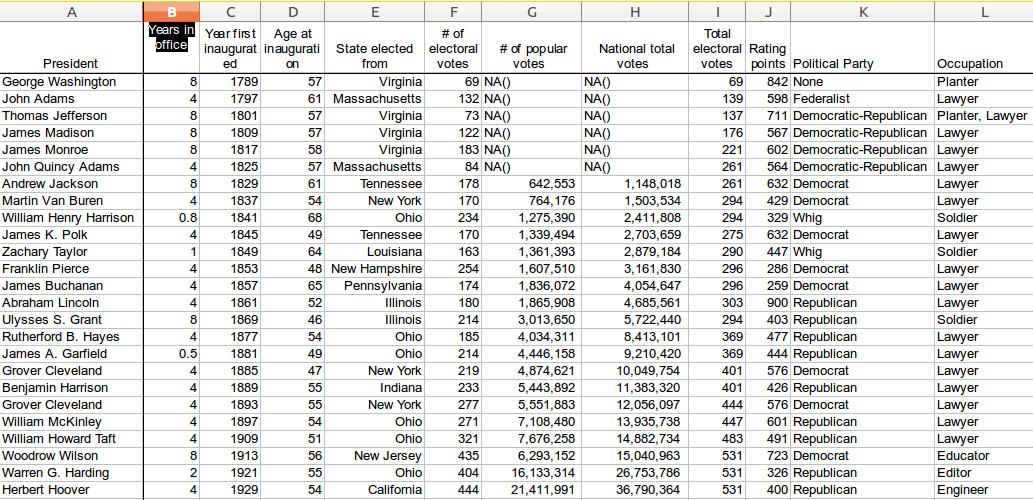
The code below reads excel data into a Python dataset (the dataset can be saved below).
|
The dataframe can be used, as shown in the example below:
|
Dataset
For purpose of demonstration, you can use the dataset from: depaul.edu.
visualize data with python
pandas read csv
Pandas is a data analaysis module. It provides you with high-performance, easy-to-use data structures and data analysis tools.
In this article you will learn how to read a csv file with Pandas.
Related course
Data Analysis with Python Pandas
Read CSV with Python Pandas
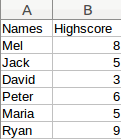
We create a comma seperated value (csv) file:
|
Imported in excel that will look like this:
The data can be read using:
|
The first lines import the Pandas module. The read_csv method loads the data in a a Pandas dataframe that we named df.
Dataframes
A dataframe can be manipulated using methods, the minimum and maximum can easily be extracted:
|
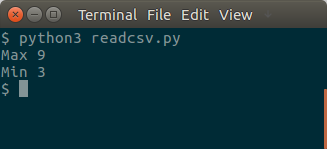
The dataset in this example is very small, but a dataset can easily contain thousands or millions of records.