
Pandas Data Structures
Pandas, a data analysis library, supports two data structures:
- Series
- DataFrames
Related courses
Practice Python with interactive exercises
Series A series can be seen as a one-dimensional array.
from pandas import DataFrame, read_csv
import matplotlib.pyplot as plt
import pandas as pd
d = { 'Netherlands': 17, 'US': 318, 'Canada': 35, 'France': 66,'UK': 64}
population = pd.Series(d)
print(population)
To get a single value use:
print(population['US'])To get a subset:
print(population[['US','Canada','UK']])You can also use operators on the series:
print(population[population > 60])Data Frames The data frame datastructure is similar to a table.
from pandas import DataFrame, read_csv
import matplotlib.pyplot as plt
import pandas as pd
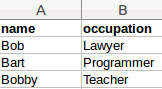
d = { 'name': ['Bob','Bart','Bobby'],
'occupation': ['Lawyer','Programmer','Teacher']}
frame = pd.DataFrame(d, columns=['name','occupation'])
print(frame)
which matches this table:
 Example Dataframe
Data may be defined manually or loaded from:
- a csv file
- an SQLite database
- an excel file .