
Python Profiling
In this article you will learn how to profile a python program.
Profiling is a form of program analysis. It can help us answer questions such as:
- how much memory is the program using?
- how much time is spent on functions?
- how much time is spent on statements?
 profiling a python application
python profiling
cProfile is a profiler included with Python. The profiler gives the total running time, tells the function call frequency and much more data.Take any program to measure, for example this simple program:
import math
print( math.factorial(1024) )
print( math.sin(1024) )
Instead of executing it the traditional way, run python like this:
python -m cProfile domath.pyYou will see something like this:
3 function calls in 0.003 seconds
Ordered by: standard name
ncalls  tottime  percall  cumtime  percall filename:lineno(function)
        1    0.001    0.001    0.003    0.003 factorial.py:1(<module>)
        1    0.001    0.001    0.001    0.001 {math.factorial}
        1    0.000    0.000    0.000    0.000 {method 'disable' of '_lsprof.Profiler' objects}
To visualize the profiling data we can use these steps:
python -m cProfile -o out.profile domath.py
sudo easy_install SquareMap RunSnakeRun
runsnake out.profile
A window will show up:
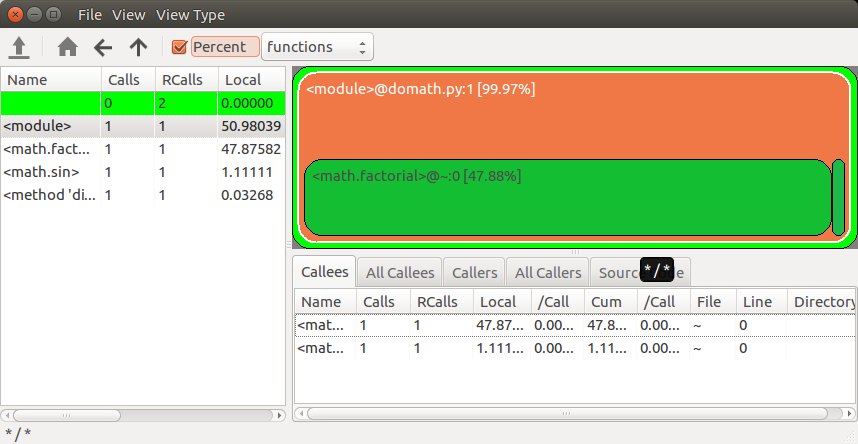
A lot of time is spent in the factorial function, the sinus function hardly takes any time (the sinus function running time is the small block on the right). We can iterate over each function and show the running time as percentage.
visualize your code flow graph
The module pycallgraph can visualize your code run time. Install it using:sudo pip install pycallgraphThe software graphviz is required, you can get it from https://graphviz.org/ or use the command:
sudo apt-get install graphvizAfter installing, run:
pycallgraph graphviz -- ./domath.pyand image called pycallgraph.png will be created. You can load it in a file explorer or type:
display pycallgraph.pngIt will output a call graph with run times:
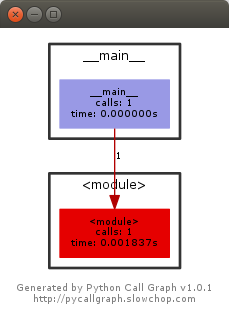 python performance profiling, a call graph with execution time
python memory profiler
To visualize run time and memory usage, we can also use vprof. Install with:pip install vprofTo show the memory use (a browser will open):
vprof -s domath.py -c mIt shows a memory plot, with total memory use, lines of code and so on:
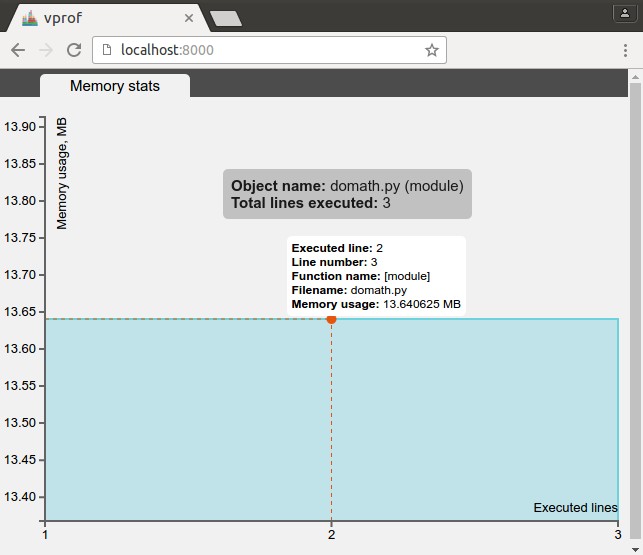 Memory profiling with Python
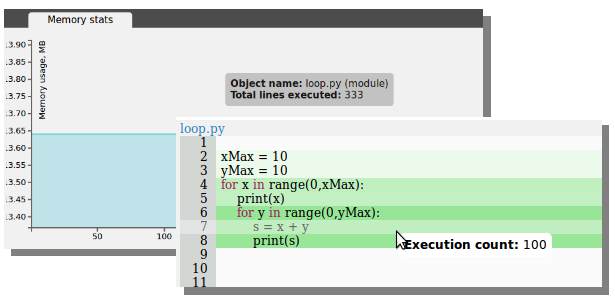
To show the number of executions for each line of code:
vprof -s domath.py -c hThe window highlights each line of code with the number of calls, the more calls the darker the lines:
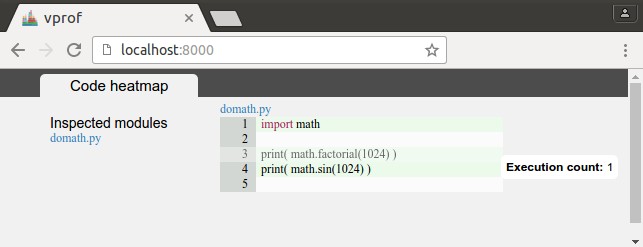 Number of executions of each line of code.
You can get a flame graph with the line:
vprof -s domath.py -c hAnd combine all graphs using:
vprof -s domath.py -c cmh