Category: pandas
Python hosting: Host, run, and code Python in the cloud!
Visualize data with Pandas
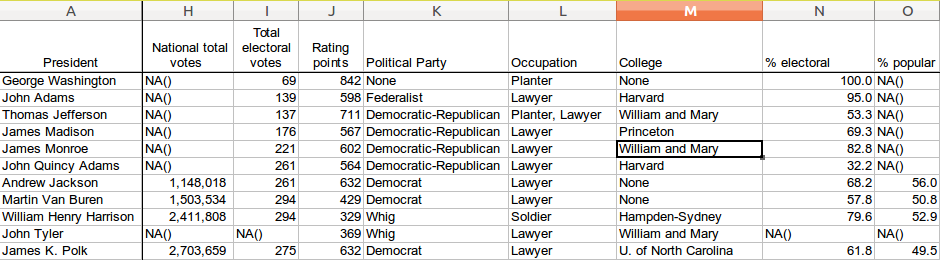
Get the xls data for this tutorial from: depaul.edu. This dataset contains a list of US presidents, associated parties,profession and more.
Related course
Data Analysis with Python Pandas
Beautiful Plots with Pandas
We can plot data of this large excel file with a few lines of code. We select the column “Occupation” for this demonstration using:
df['Occupation']. |
Full code:
from pandas import DataFrame, read_csv import matplotlib.pyplot as plt import pandas as pd file = r'data/Presidents.xls' df = pd.read_excel(file) # plot data colors = ['yellowgreen', 'gold', 'lightskyblue', 'lightcoral','red','green','blue','orange','white','brown'] df['Occupation'].value_counts().plot(kind='pie',title='Occupation by President',colors=colors) plt.show() |

Data cleaning and plotting
We can also plot the popularity by president. Before we do that, we need to clean some data:
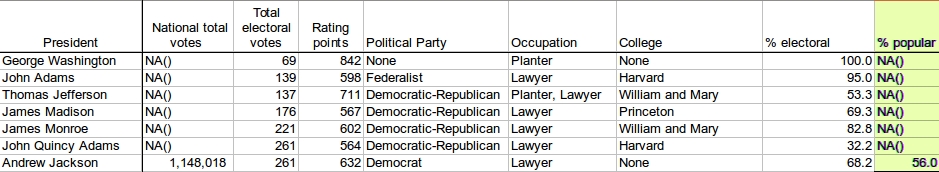
Some of the cells do not contain numerical values, we can either remove them or replace them:
#df = df.replace('NA()',0) df = df[df['% popular'] != 'NA()'] |
To plot the popularity:
from pandas import DataFrame, read_csv import matplotlib.pyplot as plt import pandas as pd file = r'data/Presidents.xls' df = pd.read_excel(file) # plot data #df = df.replace('NA()',0) df = df[df['% popular'] != 'NA()'] print( df['% popular'] ) df['% popular'].plot(kind='hist', bins=8, title='Popularity by President', facecolor='blue', alpha=0.5, normed=1) plt.show() |

Pandas read CSV
Pandas is a data analaysis module. It provides you with high-performance, easy-to-use data structures and data analysis tools.
In this article you will learn how to read a csv file with Pandas.
Related course
Data Analysis with Python Pandas
Read CSV with Python Pandas
We create a comma seperated value (csv) file:
Names,Highscore, Mel,8, Jack,5, David,3, Peter,6, Maria,5, Ryan,9, |
Imported in excel that will look like this:
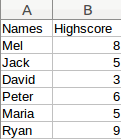
The data can be read using:
from pandas import DataFrame, read_csv import matplotlib.pyplot as plt import pandas as pd file = r'highscore.csv' df = pd.read_csv(file) print(df) |
The first lines import the Pandas module. The read_csv method loads the data in a a Pandas dataframe that we named df.
Dataframes
A dataframe can be manipulated using methods, the minimum and maximum can easily be extracted:
from pandas import DataFrame, read_csv import matplotlib.pyplot as plt import pandas as pd file = r'highscore.csv' df = pd.read_csv(file) print('Max', df['Highscore'].max()) print('Min', df['Highscore'].min()) |
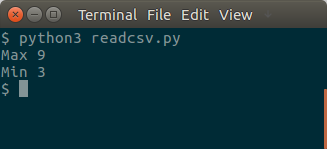
The dataset in this example is very small, but a dataset can easily contain thousands or millions of records.
Read Excel with Pandas
Excel files can be read using the Python module Pandas. In this article we will read excel files using Pandas.
Related course:
Data Analysis with Python Pandas
Read Excel column names
We import the pandas module, including ExcelFile. The method read_excel() reads the data into a Pandas Data Frame, where the first parameter is the filename and the second parameter is the sheet.
The list of columns will be called df.columns.
import pandas as pd from pandas import ExcelWriter from pandas import ExcelFile df = pd.read_excel('File.xlsx', sheetname='Sheet1') print("Column headings:") print(df.columns) |
Using the data frame, we can get all the rows below an entire column as a list. To get such a list, simply use the column header
print(df['Sepal width']) |
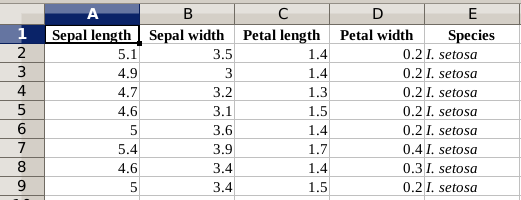
Read Excel data
We start with a simple Excel file, a subset of the Iris dataset.
To iterate over the list we can use a loop:
for i in df.index: print(df['Sepal width'][i]) |
We can save an entire column into a list:
listSepalWidth = df['Sepal width'] print(listSepalWidth[0]) |
We can simply take entire columns from an excel sheet:
import pandas as pd from pandas import ExcelWriter from pandas import ExcelFile df = pd.read_excel('File.xlsx', sheetname='Sheet1') sepalWidth = df['Sepal width'] sepalLength = df['Sepal length'] petalLength = df['Petal length'] |
Write Excel with Pandas
Excel files can be created in Python using the module Pandas. In this article we will show how to create an excel file using Python.
Related course:
Data Analysis with Python Pandas
Write Excel
We start by importing the module pandas. From the module we import ExcelWriter and ExcelFile.
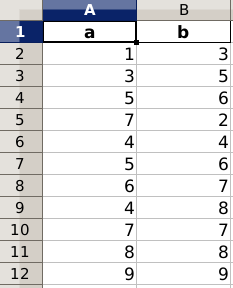
The next step is to create a data frame. In the data frame we put a list, with the name of the list as the first argument:
df = pd.DataFrame({'a':[1,3,5,7,4,5,6,4,7,8,9], 'b':[3,5,6,2,4,6,7,8,7,8,9]}) |
In this short code snippet, ‘a’ and ‘b’ are columns’. The second is the list of data the these columns will contain.
Then we write data frame to an excel file using:
writer = ExcelWriter('Pandas-Example2.xlsx') df.to_excel(writer,'Sheet1',index=False) writer.save() |
The complete code:
import pandas as pd from pandas import ExcelWriter from pandas import ExcelFile import numpy as np df = pd.DataFrame({'a':[1,3,5,7,4,5,6,4,7,8,9], 'b':[3,5,6,2,4,6,7,8,7,8,9]}) writer = ExcelWriter('Pandas-Example2.xlsx') df.to_excel(writer,'Sheet1',index=False) writer.save() |
The output of this code: