
Category: Tutorials
svm python
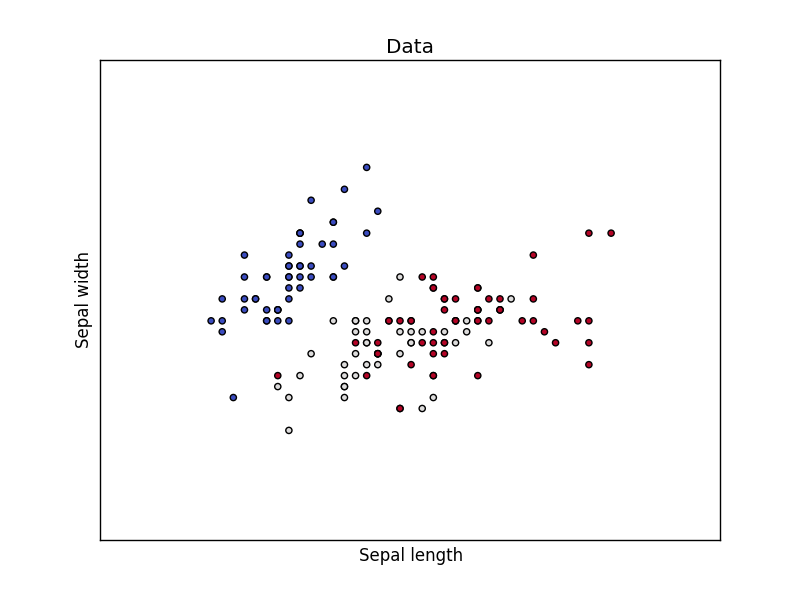
A common task in Machine Learning is to classify data. Given a data point cloud, sometimes linear classification is impossible. In those cases we can use a Support Vector Machine instead, but an SVM can also work with linear separation.
Related Course:
Dataset
We loading the Iris data, which we’ll later use to classify. This set has many features, but we’ll use only the first two features:
- sepal length
- sepal width
|
Support Vector Machine Example
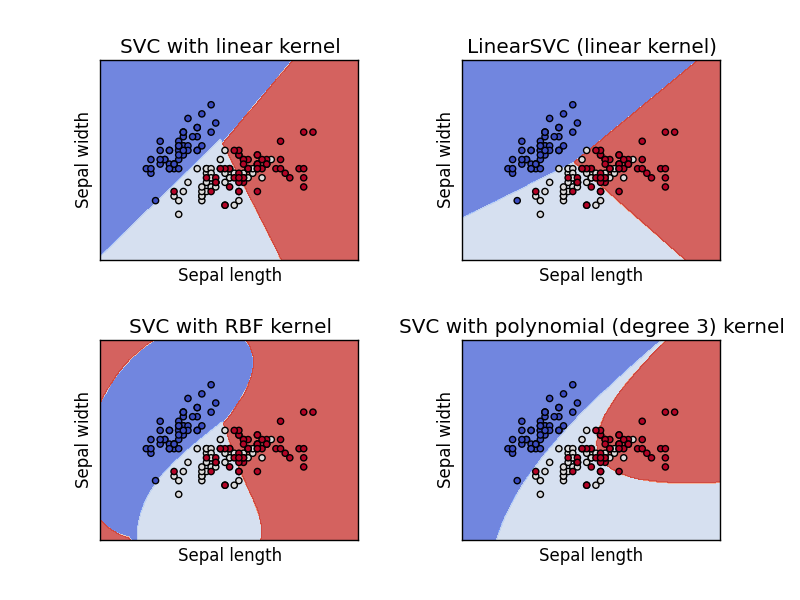
Separating two point clouds is easy with a linear line, but what if they cannot be separated by a linear line?
In that case we can use a kernel, a kernel is a function that a domain-expert provides to a machine learning algorithm (a kernel is not limited to an svm).
The example below shows SVM decision surface using 4 different kernels, of which two are linear kernels.
|
python logarithmus
Tipp
Sie können den Python-Interpreter als Taschenrechner verwenden. Dazu starten Sie einfach Python ohne IDE und Dateinamen. Beispiel:
  Python 2.7.6 (Standard, 22. Juni 2015, 17:58:13)
[GCC 4.8.2] auf linux2
Geben Sie "help", "copyright", "Credits" oder "Lizenz" für weitere Informationen.
>>> 18 * 17
306
>>> 2 ** 4
16
>>>
Related Course:
Python Programming Bootcamp: Go from zero to hero
Mathematische Funktionen
Python unterstützt eine Vielzahl von mathematischen Funktionen.
| Funktion | Gibt | Beispiel | |||
|---|---|---|---|---|---|
| Abs(x) | Der Absolute Wert von x zurückgibt. | {% codeblock lang:python line_number:false %} X =-35 X = abs(x) Print(x) {% endcodeblock %} | |||
| CMP(x,y) |
Gibt-1 zurück, wenn X < y Gibt 0 zurück, wenn x gleich y Gibt 1 zurück, wenn X > y. |
{% codeblock lang:python line_number:false %} X = 6 y = 4 Drucken (cmp(x,y)) {% endcodeblock %} | |||
| EXP(x) | Kehrt die exponentielle x | {% codeblock lang:python line_number:false %} Import-Mathematik X = 6 Drucken (math.exp(x)) {% endcodeblock %} | |||
| Log(x) | Den natürlichen Logarithmus von x | {% codeblock lang:python line_number:false %} Import-Mathematik X = 6 Drucken (math.log(x)) {% endcodeblock %} | |||
| log10(x) | Der Logarithmus Base-10 x | {% codeblock lang:python line_number:false %} Import-Mathematik X = 6 Drucken (math.log10(x)) {% endcodeblock %} | |||
| Pow(x,y) | Das Ergebnis von X ** y | {% codeblock lang:python line_number:false %} Import-Mathematik X = 6 Drucken (math.pow(x,2)) {% endcodeblock %} | |||
| sqrt(x) | Die Quadratwurzel von x | {% codeblock lang:python line_number:false %} Import-Mathematik X = 6 Drucken (math.sqrt(x)) {% endcodeblock %} |
|
We load the haar cascade file using cv2.CascadeClassifier() and we load the image using cv2.imread()
Then bodyCascade.detectMultiScale() detects regions of interest using the loaded haar features.
The image is saved as thumbnail using cv2.imwrite() and finally we show the image and highlight the region of interest with a rectangle. After running you will have a nice thumbnail for mobile webpages or apps.
If you also want to detect both body and face you can use:
|
Related course:
Master Computer Vision with OpenCV
Operaciones matemáticas
Sugerencia
Puede utilizar el intérprete de Python como calculadora. Para ello simplemente iniciar Python sin un IDE y un nombre de archivo. Ejemplo:
  Python 2.7.6 (por defecto, 22 de junio de 2015, 17:58:13)
[GCC 4.8.2] de linux2
Tipo de "ayuda", "copyright", "créditos" o "licencia" para obtener más información.
>>> 18 * 17
306
>>> 2 ** 4
16
>>>
Related Course:
Python Programming Bootcamp: Go from zero to hero
Funciones matemáticas
Python soporta una amplia variedad de funciones matemáticas.
| Función | Devuelve | Ejemplo |
|---|---|---|
| ABS(x) | Devuelve el valor absoluto de x. | {% codeblock lang:python line_number:false %} x = -35 x = abs(x) Print (x) {% endcodeblock %} |
| CMP(x,y) |
Devuelve -1 Si x < y Devuelve 0 si x es igual a y Devuelve 1 Si x > y. |
{% codeblock lang:python line_number:false %} x = 6 y = 4 Imprimir (cmp(x,y)) {% endcodeblock %} |
| exp (x) | Devuelve la exponencial de x | {% codeblock lang:python line_number:false %} importación matemáticas x = 6 Imprimir (math.exp(x)) {% endcodeblock %} |
| Cienc | El logaritmo natural de x | {% codeblock lang:python line_number:false %} importación matemáticas x = 6 Imprimir (math.log(x)) {% endcodeblock %} |
| log10(x) | El logaritmo en base 10 de x | {% codeblock lang:python line_number:false %} importación matemáticas x = 6 Imprimir (math.log10(x)) {% endcodeblock %} |
| Pow(x,y) | El resultado de x ** y | {% codeblock lang:python line_number:false %} importación matemáticas x = 6 Imprimir (math.pow(x,2)) {% endcodeblock %} |
| sqrt(x) | La raíz cuadrada de x | {% codeblock lang:python line_number:false %} importación matemáticas x = 6 Imprimir (math.sqrt(x)) {% endcodeblock %} |
python ide
Instalar un IDE de Python
Un Entorno de escritorio integrado (IDE) es un software para la programación. Además de edición de texto simple que tienen todo tipo de funciones tales como resaltado de sintaxis, completado de código, pestañas, un explorador de la clase y muchos más.
Related Course:
Python Programming Bootcamp: Go from zero to hero
Python online intérpretes
Los intérpretes en línea no funcionen para todo pero funcionarán para la mayoría de los tutoriales para principiantes. Recomiendo usar un IDE desktop o el interprete oficial de Python.
Resumen de IDEs (sólo necesita uno)
| IDE | Autor | Plataforma | Descripción | Precio | Descargar |
|---|---|---|---|---|---|
| PyCharm | JetBrains | Windows, Mac OS X, Linux/UNIX | Python IDE. Características como: completación de código, inspecciones de código, error sobre la marcha destacando y soluciones rápidas | 89 € / 1er año. ($ 97,90) | Descarga PyCharm |
| Átomo (+ script plugin) | GitHub | Windows, Mac OS X, Linux/UNIX | Python IDE. Necesita descargar el plugin de secuencia de comandos después de instalar el átomo. | Gratis. | Descargar Atom. |
| Pythonista | OMZ:software | Apple iOS (iPhone, iPad) | Las características incluyen: resaltado de sintaxis, completado de código, sistema interactivo, módulos estándar y de iOS. | € 9. ($ 9,90) | Descargar Pythonista. |
| Eclipse con PyDev | Aleks Totic | Windows, Mac OS X, Linux/UNIX | Las características incluyen: sintaxis resaltado, refactorización de código, depuración gráfica y mucho más. | Gratis | Descargar |
| Eric Python IDE | Detlev Offenbach | Windows, Linux/UNIX | Las características incluyen: resaltado de sintaxis, autocompletado, clase navegador y más. | Gratis | Descargar |
| Wing IDE | Wingware | Windows, Mac OS X, Linux/UNIX | Características: Sintaxis resaltado, auto-completado, refactorización, pruebas unitarias y versión controlan. | $45 a $245 por usuario por licencia. | Descargar |
| Komodo IDE | Komodo | Windows, Mac OS X, Linux/UNIX | Características: Sintaxis, navegador de documentación, ejecutar código en línea, marcadores rápidos y mucho más. | € 40 a € 223. ($99 a $295). | Descargar |
| Repl.it | Amjad Masad, Haya Odeh, Faris Masad y Max Shawabkeh. | Web | Intérprete de Python | Gratis | Ejecutar en línea |
| Ideone | Ideone | Web | Intérprete de Python | Gratis | Ejecutar en línea |
| CodePad | Hazel de Steven | Web | Intérprete de Python | Gratis | Ejecutar en línea |


|
More examples:
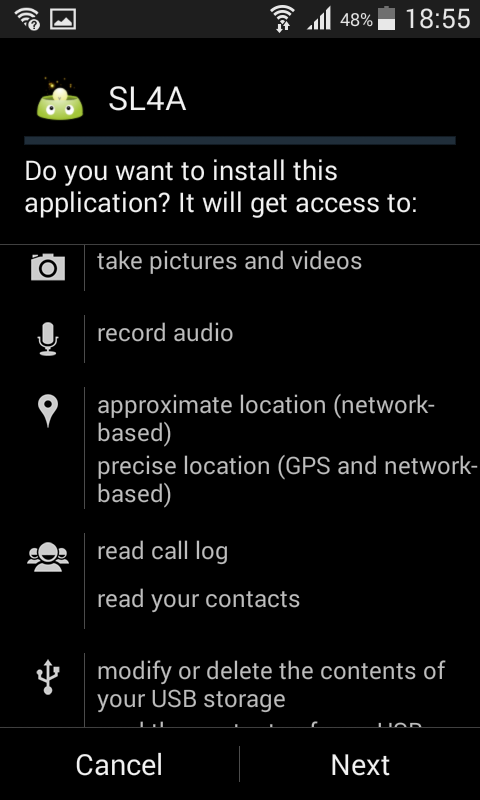
http://www.mattcutts.com/blog/android-barcode-scanner/
https://github.com/damonkohler/sl4a/blob/wiki/Tutorials.md
python web development
Introduction
Web apps are often created using a framework. Frameworks make it easier to develop web apps that are scalable, reliable and maintainable. It avoids recreating the same code over and over again.
Common features are:
- URL Routing
- Output templates
- Database management
- Session management
- Security against common attacks
A framework may offer some or all of these features.
For example, the Flask web application framework does not have database support and you would need a separate module to use a database. The Django web application framework supports databases by default.
Related course: Create Web Apps with Python Flask
Python Hosting
To run your app on the web, you will need hosting. Unless you want to do hosting yourself, you need a party to host.
Hosting servers:
Why use a web framework?
As you are doing web development, you want to avoid spending time on programming things that have already been solved. On the other hand, if you are an experienced web developer a web framework may not offer everything you need.
What Python web frameworks exist?
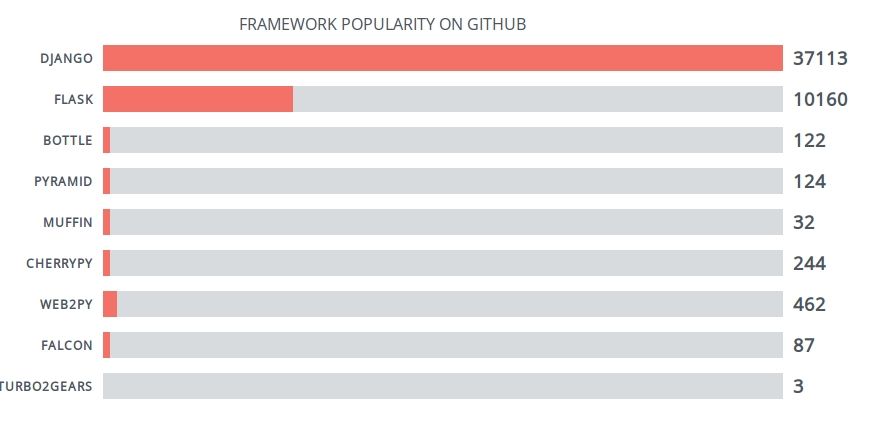
Django and Flask are the most popular web frameworks. However, you may want to evaluate the frameworks. An overview:
The most popular python web application framework is Django, followed by Flask.
Django

Django is the most used Python web framework. It takes care of many things so you can focus on the web app development. Sites built withDjango have dealt with high traffic spikes such as 50 thousands hits per second.
Database access is achieved through an Object-relational mapper: You define your data models in Python and Django deals with the actual database management systems (SQL). However, if you need to you can write your own SQL Queries with Django. URL routing is supported by Django. It encourages beautiful URL design such as ending without .php or .asp.
Features:
- Object-relational mapper
- URLs routing and views
- Template engine
- Forms
- Authentication
- Admin
- Internationalization
- Security
If you want to know more about Django, read here.
Related course: Django Web Developer Course
Flask
![]()
Flask is a Python micro framework which is modular by design. The framework is intended to build web apps. Flask does not have a specific database system or ORM system. If you want to use a database, you’ll have to use extensions. Flask is often combined with SQLAlchemy for database use.
Flask is very easy to get running, a minimal app would be:
from flask import Flask |
The framework supports URL routing, template (using Jinja2), session management and has some out of the box security.
Features:
- URL Routing and views
- Template engine
- Session management
- Logging
If you want to know more about Flask, read here.
Related course: Create Web Apps with Python Flask
image histogram
A histogram is collected counts of data organized into a set of bins. Every bin shows the frequency. OpenCV can generate histograms for both color and gray scale images. You may want to use histograms for computer vision tasks.
Related course: Master Computer Vision with OpenCV
Histogram example
Given an image we can generate a histogram for the blue, green and red values.
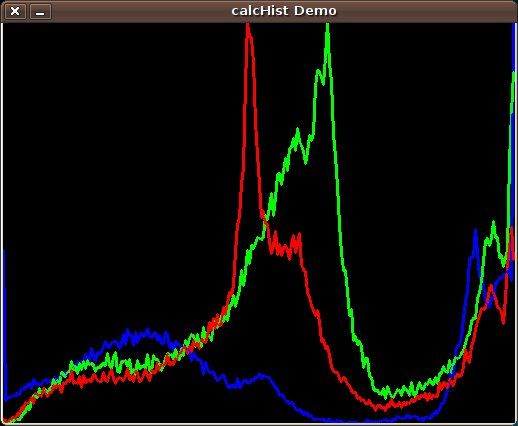
We use the function cv.CalcHist(image, channel, mask, histSize, range)
Parameters:
- image: should be in brackets, the source image of type uint8 or float32
- channel: the color channel to select. for grayscale use [0]. color image has blue, green and red channels
- mask: None if you want a histogram of the full image, otherwise a region.
- histSize: the number of bins
- range: color range:
Histogram for a color image:
# draw histogram in python. |
Related course: Master Computer Vision with OpenCV
python png
OpenCV (cv2) can be used to extract data from images and do operations on them. We demonstrate some examples of that below:
Related courses:Image properties
We can extract the width, height and color depth using the code below:
import cv2 |
Access pixel data
We can access the pixel data of an image directly using the matrix, example:
import cv2 |
To iterate over all pixels in the image you can use:
import cv2 |
Image manipulation
You can modify the pixels and pixel channels (r,g,b) directly. In the example below we remove one color channel:
import cv2 |
To change the entire image, you’ll have to change all channels: m[py][px][0], m[py][px][1], m[py][px][2].
Save image
You can save a modified image to the disk using:
cv2.imwrite('filename.png',m) |
Download Computer Vision Examples + Course
face detection python
In this tutorial you will learn how to apply face detection with Python. As input video we will use a Google Hangouts video. There are tons of Google Hangouts videos around the web and in these videos the face is usually large enough for the software to detect the faces.
Detection of faces is achieved using the OpenCV (Open Computer Vision) library. The most common face detection method is to extract cascades. This technique is known to work well with face detection. You need to have the cascade files (included in OpenCV) in the same directory as your program.
Related course
Master Computer Vision with OpenCV and Python
Video with Python OpenCV
To analyse the input video we extract each frame. Each frame is shown for a brief period of time. Start with this basic program:
#! /usr/bin/python |
Upon execution you will see the video played without sound. (OpenCV does not support sound). Inside the while loop we have every video frame inside the variable frame.
Face detection with OpenCV
We will display a rectangle on top of the face. To avoid flickering of the rectangle, we will show it at it latest known position if the face is not detected.
#! /usr/bin/python |
In this program we simply assumed there is one face in the video screen. We reduced the size of the screen to speed up the processing time. This is fine in most cases because detection will work fine in lower resolutions. If you want to execute the face detection in “real time”, keeping the computational cycle short is mandatory. An alternative to this implementation is to process first and display later.
A limitation of this technique is that it does not always detect faces and faces that are very small or occluded may not be detected. It may show false positives such as a bag detected as face. This technique works quite well on certain type of input videos.
Download Computer Vision Examples and Course
create csv file python
Spreadsheets often export CSV (comma seperated values) files, because they are easy to read and write. A csv file is simply consists of values, commas and newlines. While the file is called ‘comma seperate value’ file, you can use another seperator such as the pipe character.
Related course
Data Analysis with Python Pandas
Create a spreadsheet file (CSV) in Python
Let us create a file in CSV format with Python. We will use the comma character as seperator or delimter.
import csv |
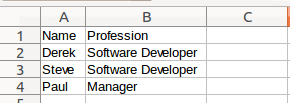
Running this code will give us this fil persons.csv with this content:
Name,Profession |
You can import the persons.csv file in your favorite office program.
Read a spreadsheet file (csv)
If you created a csv file, we can read files row by row with the code below:
import csv |
This will simply show every row as a list:
['Name', 'Profession'] |
Perhaps you want to store that into Python lists. We get the data from the csv file and then store it into Python lists. We skip the header with an if statement because it does not belong in the lists. Full code:
import csv |
Result:
['Derek', 'Steve', 'Paul'] |
Most spreadsheet or office programs can export csv files, so we recommend you to create any type of csv file and play around with it :-)
Related course
Data Analysis with Python Pandas
word cloud python
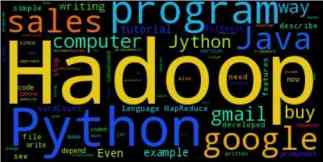
We have created a python program that generates a wordcloud based on your gmail account. The output may look something like this depending on the contents of your emails.
First you will need a small script that interacts with the gmail service. We have created a small script that interact with gmail. It relies on gmaillib installed and you will need to set: allow “less-secure” applications to access gmail server: https://www.google.com/settings/security/lesssecureapps
Related Course:
Python Programming Bootcamp: Go from zero to hero
Gmail example:
#!/usr/bin/env python |
If this script runs successfully you have almost all requirements installed. You will also need the library called wordcloud. We rebuild the system such that we get one long string containing the message bodies, which we feed as input to the wordcloud instance. The variable amount contains the number of mails to fetch. We have set it to 100 but you could set it to all messages using get_inbox_count() or you could simply fetch all emails of the last week.
Final program:
#!/usr/bin/env python |