python logo

chart flask


Python hosting: Host, run, and code Python in the cloud!
Flask piechart
Flask webapp with pie chart
In this article you will learn how to create great looking charts using Chart.js and Flask.

Chart.js is a javascript library to create simple and clean charts. All of them are HTML5 based, responsive, modular, interactive and there are in total 6 charts.

Related course
Python Flask: Make Web Apps with Python

   <meta charset="utf-8">   <title>Chart.js </title>      <!-- import plugin script -->   <script src="static/Chart.min.js"></script>
<h1>Flask Chart.js</h1>
<!-- bar chart canvas element --><canvas id="chart" width="600" height="400"></canvas>
<script><br />
// bar chart data<br />
var barData = {<br />
labels : [],<br />
datasets : [<br />
{<br />
fillColor: "rgba(151,187,205,0.2)",<br />
strokeColor: "rgba(151,187,205,1)",<br />
pointColor: "rgba(151,187,205,1)",<br />
data : []<br />
}<br />
]<br />
}</p>
<p> // get bar chart canvas<br />
var mychart = document.getElementById("chart").getContext("2d");</p>
<p> steps = 10<br />
max = 10<br />
// draw bar chart<br />
new Chart(mychart).Bar(barData, {<br />
scaleOverride: true,<br />
scaleSteps: steps,<br />
scaleStepWidth: Math.ceil(max / steps),<br />
scaleStartValue: 0,<br />
scaleShowVerticalLines: true,<br />
scaleShowGridLines : true,<br />
barShowStroke : true,<br />
scaleShowLabels: true<br />
});</p>
<p></script>


Create the directory /static/ and add the file Chart.min.js to it. You can get it either from the Chart.js website or use the link. Finally go into the home directory and create app.py with this contents:

from flask import Flask
from flask import Markup
from flask import Flask
from flask import render_template
app = Flask(__name__)

@app.route("/")
def chart():
labels = ["January","February","March","April","May","June","July","August"]
values = [10,9,8,7,6,4,7,8]
return render_template('chart.html', values=values, labels=labels)

if __name__ == "__main__":
app.run(host='0.0.0.0', port=5001)

Finally run:

python app.py


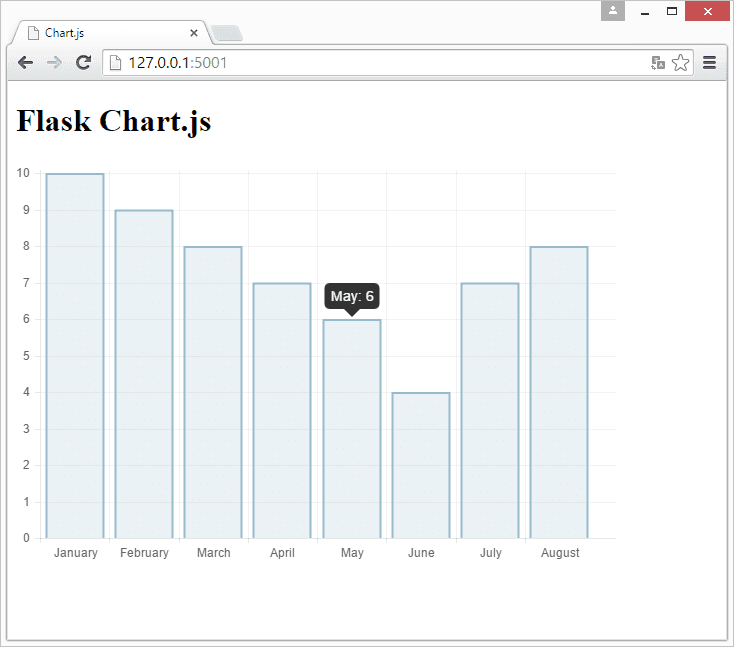
Open http://127.0.0.1:5001/ and you will see the array values[] plotted with the data in labels[].

We simply pass these two arrays to render_template(). This means that most of the magic occurs in the template. Chart.js is a client-side javascript library which is why our app.py is very minimal.


Result:
Flask barchart Flask barchart


Related course
Python Flask: Make Web Apps with Python

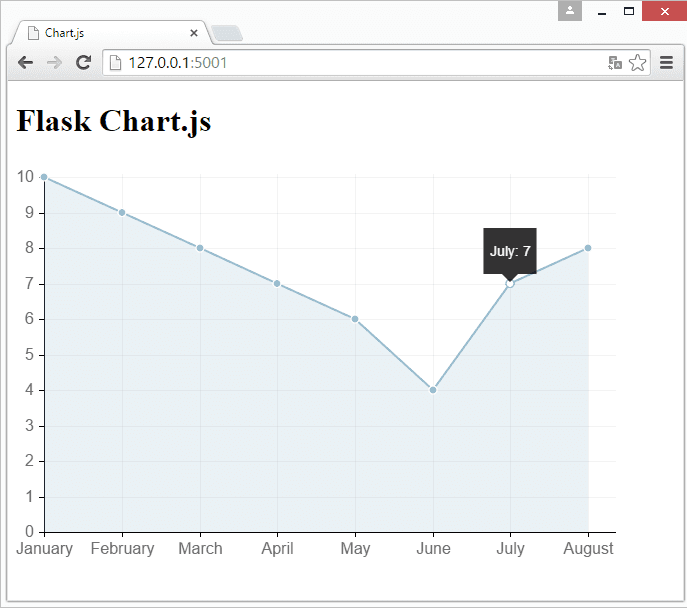
Create a line chart with Chart.js and Flask

To create a line chart, we can simply modify the chart.html template. Change it to:

<meta charset="utf-8">
<title>Chart.js </title>

<!-- import plugin script -->
<script src="static/Chart.min.js"></script>
<h1>Flask Chart.js</h1>
<!-- bar chart canvas element -->
<canvas id="chart" width="600" height="400"></canvas>

<script></p>
<p> // bar chart data<br />
var barData = {<br />
labels : [],<br />
datasets : [<br />
{<br />
fillColor: "rgba(151,187,205,0.2)",<br />
strokeColor: "rgba(151,187,205,1)",<br />
pointColor: "rgba(151,187,205,1)",<br />
pointStrokeColor: "#fff",<br />
pointHighlightFill: "#fff",<br />
pointHighlightStroke: "rgba(151,187,205,1)",<br />
bezierCurve : false,<br />
data : []<br />
}]<br />
}</p>
<p> Chart.defaults.global.animationSteps = 50;<br />
Chart.defaults.global.tooltipYPadding = 16;<br />
Chart.defaults.global.tooltipCornerRadius = 0;<br />
Chart.defaults.global.tooltipTitleFontStyle = "normal";<br />
Chart.defaults.global.tooltipFillColor = "rgba(0,0,0,0.8)";<br />
Chart.defaults.global.animationEasing = "easeOutBounce";<br />
Chart.defaults.global.responsive = false;<br />
Chart.defaults.global.scaleLineColor = "black";<br />
Chart.defaults.global.scaleFontSize = 16;</p>
<p> // get bar chart canvas<br />
var mychart = document.getElementById("chart").getContext("2d");</p>
<p> steps = 10<br />
max = 10<br />
// draw bar chart<br />
var LineChartDemo = new Chart(mychart).Line(barData, {<br />
scaleOverride: true,<br />
scaleSteps: steps,<br />
scaleStepWidth: Math.ceil(max / steps),<br />
scaleStartValue: 0,<br />
scaleShowVerticalLines: true,<br />
scaleShowGridLines : true,<br />
barShowStroke : true,<br />
scaleShowLabels: true,<br />
bezierCurve: false,</p>
<p> });</p>
<p></script>


Output:

Flask line-chart Flask line-chart

Related course
Python Flask: Make Web Apps with Python

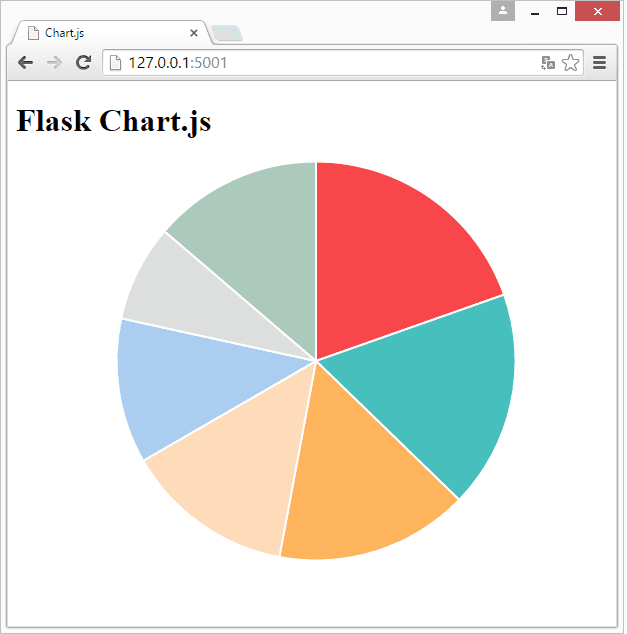
Creating a pie chart

To create a pie chart, we must modify the application code slightly. We need 3 arrays: values, labels and colors. Colors are defined in hexadecimal, as usual in HTML. To iterate them in one loop, we zip them.

from flask import Flask
from flask import Markup
from flask import Flask
from flask import render_template
app = Flask(__name__)

@app.route("/")
def chart():
labels = ["January","February","March","April","May","June","July","August"]
values = [10,9,8,7,6,4,7,8]
colors = [ "#F7464A", "#46BFBD", "#FDB45C", "#FEDCBA","#ABCDEF", "#DDDDDD", "#ABCABC" ]
return render_template('chart.html', set=zip(values, labels, colors))

if __name__ == "__main__":
app.run(host='0.0.0.0', port=5001)

Secondly we modify the template to:

   <meta charset="utf-8">   <title>Chart.js </title>      <!-- import plugin script -->   <script src="static/Chart.min.js"></script>
<h1>Flask Chart.js</h1>
<!-- bar chart canvas element --><canvas id="chart" width="600" height="400"></canvas>
<script><br />
var pieData = [<br />
</p>
<p> ];</p>
<p> // get bar chart canvas<br />
var mychart = document.getElementById("chart").getContext("2d");</p>
<p> steps = 10<br />
max = 10<br />
// draw pie chart<br />
new Chart(document.getElementById("chart").getContext("2d")).Pie(pieData);</p>
<p></script>

Result:

Flask piechart Flask piechart

Download Flask Examples


Leave a Reply:


Misha Mon, 27 Jul 2015

It's a bad idea to use templating for passing data into js code (aka filling gaps). Maybe it's easier to implement but you should make some ajax call to corresponding route on the server to fetch the data. That gives you more flexibility when switching backend/frontend to other technology and avoids mixing jinja2/javascript.

Frank Mon, 27 Jul 2015

Thanks Misha! That would be more flexible.

Gary C. Sat, 08 Aug 2015

I just stumbled across this post a couple weeks ago and thought the method seemed sane (as a JS initiate). Why do you call it filling gaps? I was able to further improve the code (IMHO) by removing the loops from the template by using the tojson filter on the variables directly. It seems to be a fairly straightforward and clean application of that method for use on mostly static data.

Gary C. Mon, 10 Aug 2015

I'm hoping that Misha sees my reply, but in the interim and as I mentioned in my reply to him, I was able to further simplify the template by using the tojson filter. Simply replace your loops with, for example:

labels: {{ labels|tojson|safe }},
...
data: {{ values|tojson|safe }},

Thoughts?

Andrew Thu, 08 Oct 2015

Can anyone point to an example or provide some demo code that will do this ajax call? Sorry I am very new to javascript.