
Linear Regression
How does regression relate to machine learning?
Given data, we can try to find the best fit line. After we discover the best fit line, we can use it to make predictions.
Consider we have data about houses: price, size, driveway and so on. You can download the dataset for this article here.
Data can be any data saved from Excel into a csv format, we will use Python Pandas to load the data.
Related courses
Required modules You shoud have a few modules installed:
sudo pip install sklearn
sudo pip install scipy
sudo pip install scikit-learn
Load dataset and plot You can choose the graphical toolkit, this line is optional:
matplotlib.use('GTKAgg')We start by loading the modules, and the dataset. Without data we can't make good predictions.
The first step is to load the dataset. The data will be loaded using Python Pandas, a data analysis module. It will be loaded into a structure known as a Panda Data Frame, which allows for each manipulation of the rows and columns.
We create two arrays: X (size) and Y (price). Intuitively we'd expect to find some correlation between price and size.
The data will be split into a trainining and test set. Once we have the test data, we can find a best fit line and make predictions.
import matplotlib
matplotlib.use('GTKAgg')
import matplotlib.pyplot as plt
import numpy as np
from sklearn import datasets, linear_model
import pandas as pd
# Load CSV and columns
df = pd.read_csv("Housing.csv")
Y = df['price']
X = df['lotsize']
X=X.reshape(len(X),1)
Y=Y.reshape(len(Y),1)
# Split the data into training/testing sets
X_train = X[:-250]
X_test = X[-250:]
# Split the targets into training/testing sets
Y_train = Y[:-250]
Y_test = Y[-250:]
# Plot outputs
plt.scatter(X_test, Y_test,  color='black')
plt.title('Test Data')
plt.xlabel('Size')
plt.ylabel('Price')
plt.xticks(())
plt.yticks(())
plt.show()
Finally we plot the test data.
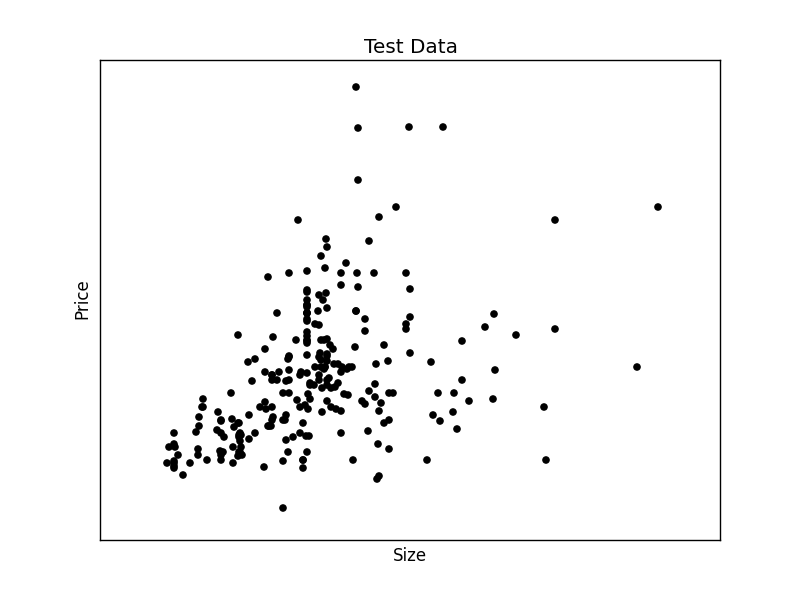
We have created the two datasets and have the test data on the screen. We can continue to create the best fit line:
# Create linear regression object
regr = linear_model.LinearRegression()
# Train the model using the training sets
regr.fit(X_train, Y_train)
# Plot outputs
plt.plot(X_test, regr.predict(X_test), color='red',linewidth=3)
This will output the best fit line for the given test data.

To make an individual prediction using the linear regression model:
print( str(round(regr.predict(5000))) )