python logo


Tag: machine learning

kneighborsclassifier

Computers can automatically classify data using the k-nearest-neighbor algorithm.

For instance: given the sepal length and width, a computer program can determine if the flower is an Iris Setosa, Iris Versicolour or another type of flower.

Related courses

Dataset
We start with data, in this case a dataset of plants.

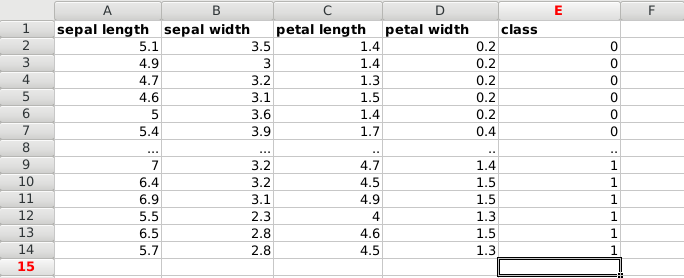
Each plant has unique features: sepal length, sepal width, petal length and petal width. The measurements of different plans can be taken and saved into a spreadsheet.

The type of plant (species) is also saved, which is either of these classes:


  • Iris Setosa (0)

  • Iris Versicolour (1)

  • Iris Virginica (2)


Put it all together, and we have a dataset:

Machine Learning Dataset

We load the data. This is a famous dataset, it’s included in the module. Otherwise you can load a dataset using python pandas.


import matplotlib
matplotlib.use('GTKAgg')

import numpy as np
import matplotlib.pyplot as plt
from matplotlib.colors import ListedColormap
from sklearn import neighbors, datasets

# import some data to play with
iris = datasets.load_iris()

# take the first two features
X = iris.data[:, :2]
y = iris.target

print(X)

X contains the first two features, being the rows sepal length and sepal width. The Y list contains the classes for the features.

Plot data
We will use the two features of X to create a plot. Where we use X[:,0] on one axis and X[:,1] on the other.


import matplotlib
matplotlib.use('GTKAgg')

import numpy as np
import matplotlib.pyplot as plt
from matplotlib.colors import ListedColormap
from sklearn import neighbors, datasets

# import some data to play with
iris = datasets.load_iris()

# take the first two features
X = iris.data[:, :2]
y = iris.target
h = .02 # step size in the mesh

# Calculate min, max and limits
x_min, x_max = X[:, 0].min() - 1, X[:, 0].max() + 1
y_min, y_max = X[:, 1].min() - 1, X[:, 1].max() + 1
xx, yy = np.meshgrid(np.arange(x_min, x_max, h), np.arange(y_min, y_max, h))

# Put the result into a color plot
plt.figure()
plt.scatter(X[:, 0], X[:, 1])
plt.xlim(xx.min(), xx.max())
plt.ylim(yy.min(), yy.max())
plt.title("Data points")
plt.show()

This will output the data:
scatter plot

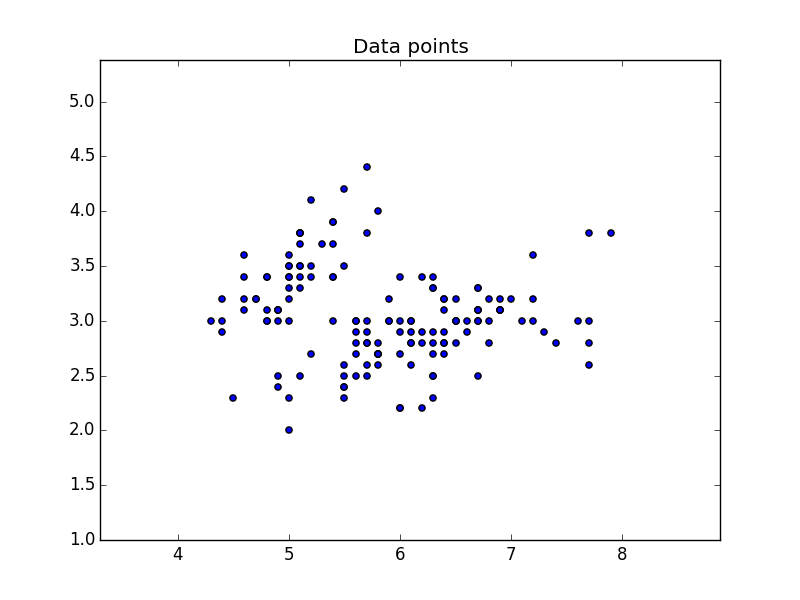
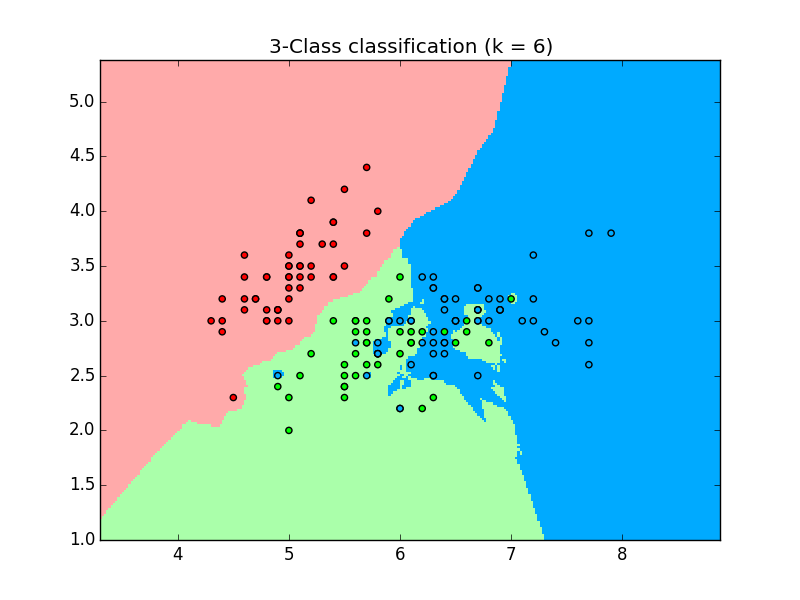
Classify with k-nearest-neighbor
We can classify the data using the kNN algorithm. We create and fit the data using:


clf = neighbors.KNeighborsClassifier(n_neighbors, weights='distance')
clf.fit(X, y)

And predict the class using


clf.predict()

This gives us the following code:


import matplotlib
matplotlib.use('GTKAgg')

import numpy as np
import matplotlib.pyplot as plt
from matplotlib.colors import ListedColormap
from sklearn import neighbors, datasets

n_neighbors = 6

# import some data to play with
iris = datasets.load_iris()

# prepare data
X = iris.data[:, :2]
y = iris.target
h = .02

# Create color maps
cmap_light = ListedColormap(['#FFAAAA', '#AAFFAA','#00AAFF'])
cmap_bold = ListedColormap(['#FF0000', '#00FF00','#00AAFF'])

# we create an instance of Neighbours Classifier and fit the data.
clf = neighbors.KNeighborsClassifier(n_neighbors, weights='distance')
clf.fit(X, y)

# calculate min, max and limits
x_min, x_max = X[:, 0].min() - 1, X[:, 0].max() + 1
y_min, y_max = X[:, 1].min() - 1, X[:, 1].max() + 1
xx, yy = np.meshgrid(np.arange(x_min, x_max, h),
np.arange(y_min, y_max, h))

# predict class using data and kNN classifier
Z = clf.predict(np.c_[xx.ravel(), yy.ravel()])

# Put the result into a color plot
Z = Z.reshape(xx.shape)
plt.figure()
plt.pcolormesh(xx, yy, Z, cmap=cmap_light)

# Plot also the training points
plt.scatter(X[:, 0], X[:, 1], c=y, cmap=cmap_bold)
plt.xlim(xx.min(), xx.max())
plt.ylim(yy.min(), yy.max())
plt.title("3-Class classification (k = %i)" % (n_neighbors))
plt.show()

which outputs the plot using the 3 classes:
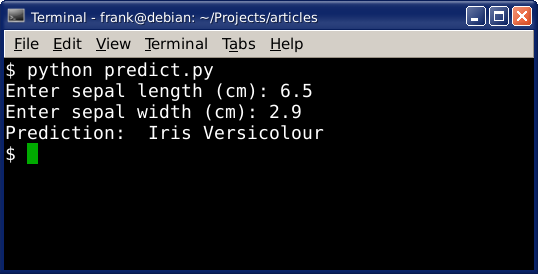
knn classes, machine learning

Prediction
We can use this data to make predictions. Given the position on the plot (which is determined by the features), it’s assigned a class. We can put a new data on the plot and predict which class it belongs to.

The code below will make prediction based on the input given by the user:


import numpy as np
from sklearn import neighbors, datasets
from sklearn import preprocessing

n_neighbors = 6

# import some data to play with
iris = datasets.load_iris()

# prepare data
X = iris.data[:, :2]
y = iris.target
h = .02

# we create an instance of Neighbours Classifier and fit the data.
clf = neighbors.KNeighborsClassifier(n_neighbors, weights='distance')
clf.fit(X, y)

# make prediction
sl = raw_input('Enter sepal length (cm): ')
sw = raw_input('Enter sepal width (cm): ')
dataClass = clf.predict([[sl,sw]])
print('Prediction: '),

if dataClass == 0:
print('Iris Setosa')
elif dataClass == 1:
print('Iris Versicolour')
else:
print('Iris Virginica')

Example output:
prediction, machine learning

Download Examples and Course

linear regression datasets csv python