
Matplotlib legend
Matplotlib has native support for legends. Legends can be placed in various positions: A legend can be placed inside or outside the chart and the position can be moved.
The legend() method adds the legend to the plot. In this article we will show you some examples of legends using matplotlib.
Related course
Practice Python with interactive exercises
Matplotlib legend inside To place the legend inside, simply call legend():
import matplotlib.pyplot as plt
import numpy as np
y = [2,4,6,8,10,12,14,16,18,20]
y2 = [10,11,12,13,14,15,16,17,18,19]
x = np.arange(10)
fig = plt.figure()
ax = plt.subplot(111)
ax.plot(x, y, label='$y = numbers')
ax.plot(x, y2, label='$y2 = other numbers')
plt.title('Legend inside')
ax.legend()
plt.show()
 Matplotlib legend inside
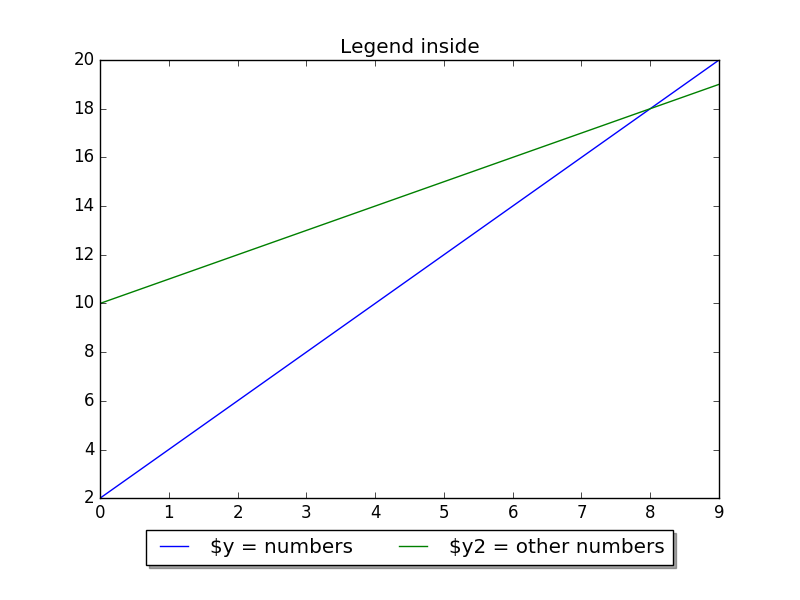
Matplotlib legend on bottom To place the legend on the bottom, change the legend() call to:
ax.legend(loc='upper center', bbox_to_anchor=(0.5, -0.05), shadow=True, ncol=2)Take into account that we set the number of columns two ncol=2 and set a shadow.
The complete code would be:
import matplotlib.pyplot as plt
import numpy as np
y = [2,4,6,8,10,12,14,16,18,20]
y2 = [10,11,12,13,14,15,16,17,18,19]
x = np.arange(10)
fig = plt.figure()
ax = plt.subplot(111)
ax.plot(x, y, label='$y = numbers')
ax.plot(x, y2, label='$y2 = other numbers')
plt.title('Legend inside')
ax.legend(loc='upper center', bbox_to_anchor=(0.5, -0.05),  shadow=True, ncol=2)
plt.show()
 Legend placed on bottom
Matplotlib legend on top To put the legend on top, change the bbox_to_anchor values:
ax.legend(loc='upper center', bbox_to_anchor=(0.5, 1.00), shadow=True, ncol=2)Code:
import matplotlib.pyplot as plt
import numpy as np
y = [2,4,6,8,10,12,14,16,18,20]
y2 = [10,11,12,13,14,15,16,17,18,19]
x = np.arange(10)
fig = plt.figure()
ax = plt.subplot(111)
ax.plot(x, y, label='$y = numbers')
ax.plot(x, y2, label='$y2 = other numbers')
plt.title('Legend inside')
ax.legend(loc='upper center', bbox_to_anchor=(0.5, 1.00), shadow=True, ncol=2)
plt.show()
 Legend on top
Legend outside right We can put the legend ouside by resizing the box and puting the legend relative to that:
chartBox = ax.get_position()
ax.set_position([chartBox.x0, chartBox.y0, chartBox.width*0.6, chartBox.height])
ax.legend(loc='upper center', bbox_to_anchor=(1.45, 0.8), shadow=True, ncol=1)
Code:
import matplotlib.pyplot as plt
import numpy as np
y = [2,4,6,8,10,12,14,16,18,20]
y2 = [10,11,12,13,14,15,16,17,18,19]
x = np.arange(10)
fig = plt.figure()
ax = plt.subplot(111)
ax.plot(x, y, label='$y = numbers')
ax.plot(x, y2, label='$y2 = other numbers')
plt.title('Legend outside')
chartBox = ax.get_position()
ax.set_position([chartBox.x0, chartBox.y0, chartBox.width*0.6, chartBox.height])
ax.legend(loc='upper center', bbox_to_anchor=(1.45, 0.8), shadow=True, ncol=1)
plt.show()
 Matplotlib legend outside