
python debugger
Python hosting: Host, run, and code Python in the cloud!
We can use debugging tools to minimize and find bugs. In this article you will learn the best Python debugging tricks.
PuDB - A console-based Python debugger
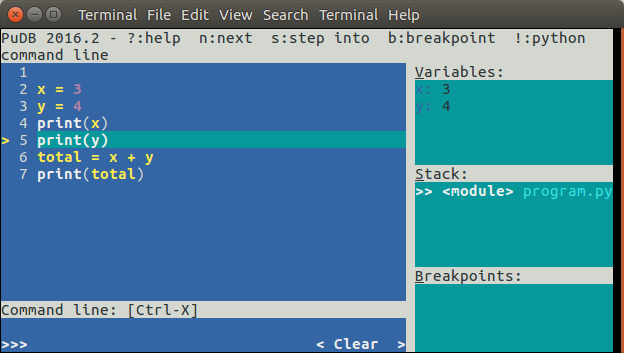
A graphical interface is shown using the PuDB terminal.
Related course:
Python Programming Bootcamp: Go from zero to hero
Installation
to install with Python 3:
|
for Python 2.x use:
|
Debugging
Start debugging with:
|
(or sudo if you don’t have the right permissions)
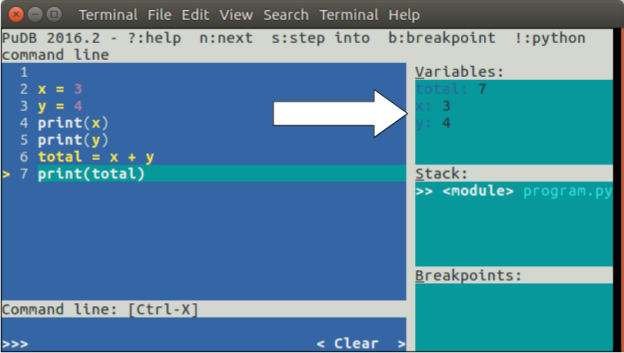
You can take step by step through the program. Use the n key to take a step through the program. The current variable contents are shown on the right top.
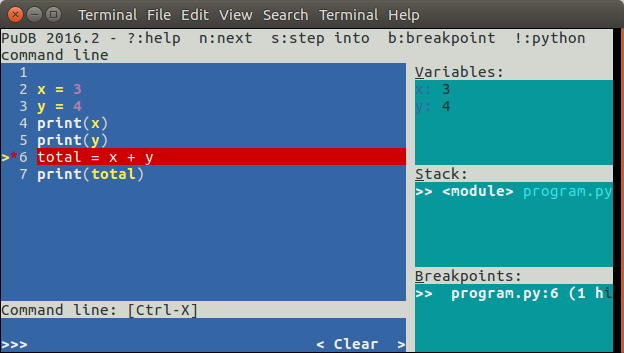
You can set breakpoints using the b key. To continue execution until the next breakpoints, press the c key.
Related course:
Python Programming Bootcamp: Go from zero to hero
PDB - The Python Debugger
The module pdb supports setting breakpoints. A breakpoint is an intentional pause of the program. where you can get more information about the programs state.
To set a breakpoint, insert the line
|
Example
A practical example:
|
We have inserted a few breakpoints in this program. The program will pause at each breakpoint (pdb.set_trace()). To view a variables contents simply type the variable name:
|
Press c or continue to go on with the programs execution until the next breakpoint
|
Related course:
Python Programming Bootcamp: Go from zero to hero
Leave a Reply: