Tag: scatterplot
3d scatter plot python
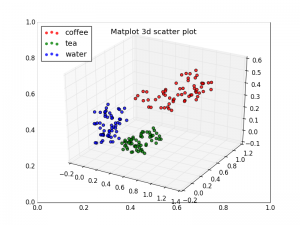
Matplotlib can create 3d plots. Making a 3D scatterplot is very similar to creating a 2d, only some minor differences. On some occasions, a 3d scatter plot may be a better data visualization than a 2d plot. To create 3d plots, we need to import axes3d.
Related course:
Introduction
It is required to import axes3d:
|
Give the data a z-axis and set the figure to 3d projection:
|

3d scatterplot
Complete 3d scatterplot example below:
|
The plot is created using several steps:
- vector creation (g1,g2,g3)
- list creation (groups)
- plotting
The final plot is shown with plt.show()
