
Category: gui
Python hosting: Host, run, and code Python in the cloud!
Matplotlib save figure to image file
Related course
The course below is all about data visualization:
Save figure
Matplotlib can save plots directly to a file using savefig().
The method can be used like this:
fig.savefig('plot.png') |
Complete example:
import matplotlib import matplotlib.pyplot as plt import numpy as np y = [2,4,6,8,10,12,14,16,18,20] x = np.arange(10) fig = plt.figure() ax = plt.subplot(111) ax.plot(x, y, label='$y = numbers') plt.title('Legend inside') ax.legend() #plt.show() fig.savefig('plot.png') |
To change the format, simply change the extension like so:
fig.savefig('plot.pdf') |
You can open your file using
display plot.png |
or open it in an image or pdf viewer,

Matplotlib update plot
Updating a matplotlib plot is straightforward. Create the data, the plot and update in a loop.
Setting interactive mode on is essential: plt.ion(). This controls if the figure is redrawn every draw() command. If it is False (the default), then the figure does not update itself.
Related courses:
Update plot example
Copy the code below to test an interactive plot.
import matplotlib.pyplot as plt import numpy as np x = np.linspace(0, 10*np.pi, 100) y = np.sin(x) plt.ion() fig = plt.figure() ax = fig.add_subplot(111) line1, = ax.plot(x, y, 'b-') for phase in np.linspace(0, 10*np.pi, 100): line1.set_ydata(np.sin(0.5 * x + phase)) fig.canvas.draw() |

Explanation
We create the data to plot using:
x = np.linspace(0, 10*np.pi, 100) y = np.sin(x) |
Turn on interacive mode using:
plt.ion() |
Configure the plot (the ‘b-‘ indicates a blue line):
fig = plt.figure() ax = fig.add_subplot(111) line1, = ax.plot(x, y, 'b-') |
And finally update in a loop:
for phase in np.linspace(0, 10*np.pi, 100): line1.set_ydata(np.sin(0.5 * x + phase)) fig.canvas.draw() |
Plot time with matplotlib
Matplotlib supports plots with time on the horizontal (x) axis. The data values will be put on the vertical (y) axis. In this article we’ll demonstrate that using a few examples.
It is required to use the Python datetime module, a standard module.
Related course
Plot time
You can plot time using a timestamp:
import matplotlib import matplotlib.pyplot as plt import numpy as np import datetime # create data y = [ 2,4,6,8,10,12,14,16,18,20 ] x = [datetime.datetime.now() + datetime.timedelta(hours=i) for i in range(len(y))] # plot plt.plot(x,y) plt.gcf().autofmt_xdate() plt.show() |

If you want to change the interval use one of the lines below:
# minutes x = [datetime.datetime.now() + datetime.timedelta(minutes=i) for i in range(len(y))] |
Time plot from specific hour/minute
To start from a specific date, create a new timestamp using datetime.datetime(year, month, day, hour, minute).
Full example:
import matplotlib import matplotlib.pyplot as plt import numpy as np import datetime # create data customdate = datetime.datetime(2016, 1, 1, 13, 30) y = [ 2,4,6,8,10,12,14,16,18,20 ] x = [customdate + datetime.timedelta(hours=i) for i in range(len(y))] # plot plt.plot(x,y) plt.gcf().autofmt_xdate() plt.show() |
Generate heatmap in Matplotlib
A heatmap can be created using Matplotlib and numpy.
Related courses
If you want to learn more on data visualization, these courses are good:
Heatmap example
The histogram2d function can be used to generate a heatmap.
We create some random data arrays (x,y) to use in the program. We set bins to 64, the resulting heatmap will be 64×64. If you want another size change the number of bins.
import numpy as np import numpy.random import matplotlib.pyplot as plt # Create data x = np.random.randn(4096) y = np.random.randn(4096) # Create heatmap heatmap, xedges, yedges = np.histogram2d(x, y, bins=(64,64)) extent = [xedges[0], xedges[-1], yedges[0], yedges[-1]] # Plot heatmap plt.clf() plt.title('Pythonspot.com heatmap example') plt.ylabel('y') plt.xlabel('x') plt.imshow(heatmap, extent=extent) plt.show() |
Result:

The datapoints in this example are totally random and generated using np.random.randn()
Tk window and button
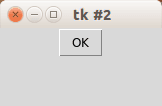
Tk button with onClick event
To create a Tkinter window with a button use the example below. The program enters mainloop() which wait for events (user actions). We define the button which has a callback to the function callback(). master is the root window, the window where your button will appear in.
from Tkinter import * master = Tk() def callback(): print "click!" b = Button(master, text="OK", command=callback) b.pack() mainloop() |
Related course
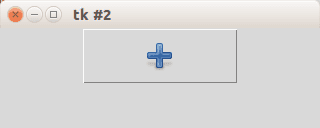
Tk image button
If you want an image button, use the PhotoImage class. We set the size of the window and the miminum size with the functions minsize() and geometry(). Example:
from Tkinter import * master = Tk() master.minsize(300,100) master.geometry("320x100") def callback(): print "click!" photo=PhotoImage(file="add.png") b = Button(master,image=photo, command=callback, height=50, width=150) b.pack() mainloop() |
Result:
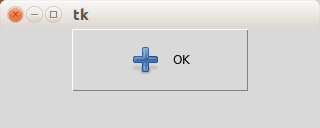
Tk Image button with text label
If you want both an image and text, simply add the parameter compound=LEFT.
from Tkinter import * master = Tk() master.minsize(300,100) master.geometry("320x100") def callback(): print "click!" photo=PhotoImage(file="add.png") b = Button(master,image=photo, text="OK", command=callback, height=50, width=150, compound=LEFT) b.pack() mainloop() |
Result:
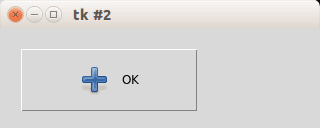
Button location
If you want to place the button on your coordinates do not use the pack() function but instead use the function place(x,y), as shown in the example below:
from Tkinter import * master = Tk() master.minsize(300,100) master.geometry("320x100") def callback(): print "click!" photo=PhotoImage(file="add.png") b = Button(master,image=photo, text="OK", command=callback, height=50, width=150, compound=LEFT) b.place(x = 20, y = 20) mainloop() |
Result:
PyQt4 textbox

In this article you will learn how to interact with a textbox using PyQt4.
If you want to display text in a textbox (QLineEdit) you could use the setText() method.
Related course:
PyQt4 QLineEdit
The textbox example below changes the text if the button is pressed.
import sys from PyQt4.QtCore import pyqtSlot from PyQt4.QtGui import * # create our window app = QApplication(sys.argv) w = QWidget() w.setWindowTitle('Textbox example @pythonspot.com') # Create textbox textbox = QLineEdit(w) textbox.move(20, 20) textbox.resize(280,40) # Set window size. w.resize(320, 150) # Create a button in the window button = QPushButton('Click me', w) button.move(20,80) # Create the actions @pyqtSlot() def on_click(): textbox.setText("Button clicked.") # connect the signals to the slots button.clicked.connect(on_click) # Show the window and run the app w.show() app.exec_() |
The text field is created with the lines:
textbox = QLineEdit(w) textbox.move(20, 20) textbox.resize(280,40) |
The button (from screenshot) is made with:
button = QPushButton('Click me', w) |
We connect the button to the on_click function by:
# connect the signals to the slots button.clicked.connect(on_click) |
This function sets the textbox using setText().