
Matplot Matrix Correlation
A correlation diagram can be created using Matplotlib. Matplotlib is the most used plotting library for Python. It can be included in all the graphical toolkits that are available for Python.
Matrix definition To start we define a 2x2 matrix and a list called groups. The matrix is defined inside the brackets (double [[ and ]] if written on a single line).
m = [
[1,0,2,0,0],
[1,1,1,2,0],
[0,4,1,0,0],
[0,4,4,1,2],
[1,3,0,0,1],
]
groups = ['Blues','Jazz','Rock','House','Dance']
Visual:
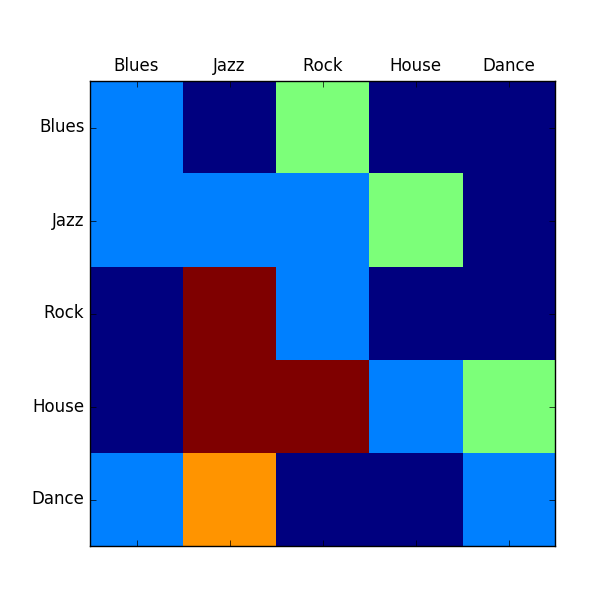 Correlation using Matplotlib
Matrix correlation
The code below generates a Matrix correlation diagram using Matplotlib.import matplotlib.pyplot as plt
import numpy as np
m = [
[1,0,2,0,0],
[1,1,1,2,0],
[0,4,1,0,0],
[0,4,4,1,2],
[1,3,0,0,1],
]
plt.matshow(m)
groups = ['Blues','Jazz','Rock','House','Dance']
x_pos = np.arange(len(groups))
plt.xticks(x_pos,groups)
y_pos = np.arange(len(groups))
plt.yticks(y_pos,groups)
plt.show()
Initially we define the matrix (m) and the list (groups). We set the length to be equal to the length of the groups. On the x axis and y axis we set the group names.