Python hosting : Host, run, and code Python in the cloud!
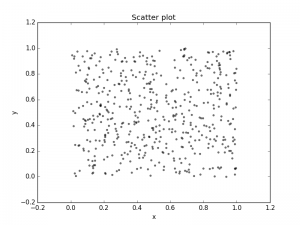
Matplot has a built-in function to create scatterplots called scatter(). A scatter plot is a type of plot that shows the data as a collection of points. The position of a point depends on its two-dimensional value, where each value is a position on either the horizontal or vertical dimension.
Related course
Scatterplot example
import numpy as npimport matplotlib.pyplot as pltN = 500 x = np.random.rand(N) y = np.random.rand(N) colors = (0 ,0 ,0 ) area = np.pi*3 plt.scatter(x, y, s=area, c=colors, alpha=0.5 ) plt.title('Scatter plot pythonspot.com' ) plt.xlabel('x' ) plt.ylabel('y' ) plt.show()
Matplotlib Scatter plot with groups
import numpy as npimport matplotlib.pyplot as pltN = 60 g1 = (0.6 + 0.6 * np.random.rand(N), np.random.rand(N)) g2 = (0.4 +0.3 * np.random.rand(N), 0.5 *np.random.rand(N)) g3 = (0.3 *np.random.rand(N),0.3 *np.random.rand(N)) data = (g1, g2, g3) colors = ("red" , "green" , "blue" ) groups = ("coffee" , "tea" , "water" ) fig = plt.figure() ax = fig.add_subplot(1 , 1 , 1 , axisbg="1.0" ) for data, color, group in zip (data, colors, groups):x, y = data ax.scatter(x, y, alpha=0.8 , c=color, edgecolors='none' , s=30 , label=group) plt.title('Matplot scatter plot' ) plt.legend(loc=2 ) plt.show()
Related course


Leave a Reply: