
Matplotlib Subplot
The Matplotlib subplot() function can be called to plot two or more plots in one figure. Matplotlib supports all kind of subplots including 2x1 vertical, 2x1 horizontal or a 2x2 grid.
Horizontal subplot Use the code below to create a horizontal subplot
from pylab import *
t = arange(0.0, 20.0, 1)
s = [1,2,3,4,5,6,7,8,9,10,11,12,13,14,15,16,17,18,19,20]
subplot(2,1,1)
xticks([]), yticks([])
title('subplot(2,1,1)')
plot(t,s)
subplot(2,1,2)
xticks([]), yticks([])
title('subplot(2,1,2)')
plot(t,s,'r-')
show()
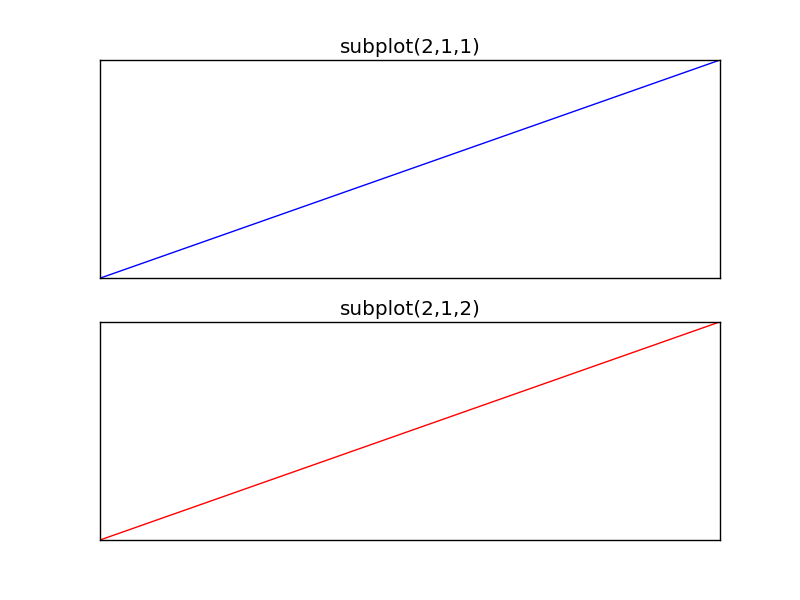 matplotlib subplot
Vertical subplot By changing the subplot parameters we can create a vertical plot
from pylab import *
t = arange(0.0, 20.0, 1)
s = [1,2,3,4,5,6,7,8,9,10,11,12,13,14,15,16,17,18,19,20]
subplot(1,2,1)
xticks([]), yticks([])
title('subplot(1,2,1)')
plot(t,s)
subplot(1,2,2)
xticks([]), yticks([])
title('subplot(1,2,2)')
plot(t,s,'r-')
show()
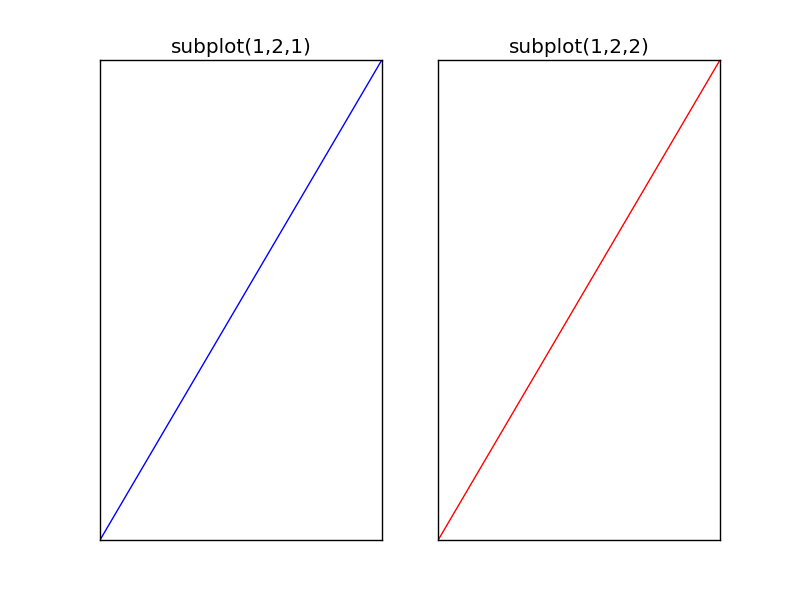 matplotlib subplot vertical
Subplot grid To create a 2x2 grid of plots, you can use this code:
from pylab import *
t = arange(0.0, 20.0, 1)
s = [1,2,3,4,5,6,7,8,9,10,11,12,13,14,15,16,17,18,19,20]
subplot(2,2,1)
xticks([]), yticks([])
title('subplot(2,2,1)')
plot(t,s)
subplot(2,2,2)
xticks([]), yticks([])
title('subplot(2,2,2)')
plot(t,s,'r-')
subplot(2,2,3)
xticks([]), yticks([])
title('subplot(2,2,3)')
plot(t,s,'g-')
subplot(2,2,4)
xticks([]), yticks([])
title('subplot(2,2,4)')
plot(t,s,'y-')
show()
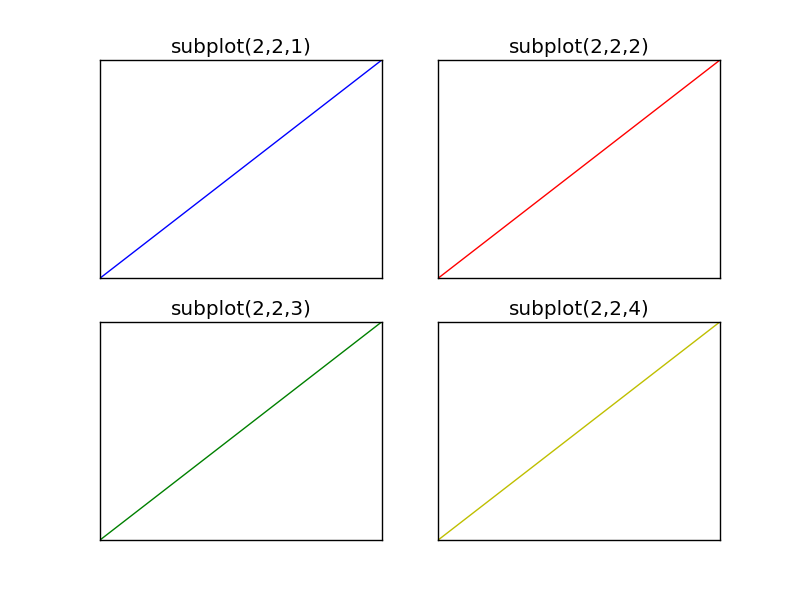 subplot grid