
Category: gui
Python hosting: Host, run, and code Python in the cloud!
Qt4 buttons
PyQt4 (Qt4) supports buttons through the QPushButton widget.
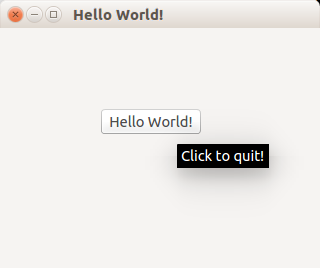
We extend the code to display a button in the center of the window.
The button will show a tooltip if hovered and when pressed will close the program.
Related course:
PyQt4 button example
The example below adds a button to a PyQt4 window.
#! /usr/bin/env python # -*- coding: utf-8 -*- # import sys from PyQt4.QtGui import * # Create an PyQT4 application object. a = QApplication(sys.argv) # The QWidget widget is the base class of all user interface objects in PyQt4. w = QWidget() # Set window size. w.resize(320, 240) # Set window title w.setWindowTitle("Hello World!") # Add a button btn = QPushButton('Hello World!', w) btn.setToolTip('Click to quit!') btn.clicked.connect(exit) btn.resize(btn.sizeHint()) btn.move(100, 80) # Show window w.show() sys.exit(a.exec_()) |
PyQt4 signals and slots
A button click should do something. To do so, you must use signals and slots.
If a user does an action such as clicking on a button, typing text in a box – the widget sends out a signal. Signals can be connected with a slot, that acts as a receiver and acts on it.
import sys from PyQt4.QtCore import pyqtSlot from PyQt4.QtGui import * # create our window app = QApplication(sys.argv) w = QWidget() w.setWindowTitle('Button click example @pythonspot.com') # Create a button in the window btn = QPushButton('Click me', w) # Create the actions @pyqtSlot() def on_click(): print('clicked') @pyqtSlot() def on_press(): print('pressed') @pyqtSlot() def on_release(): print('released') # connect the signals to the slots btn.clicked.connect(on_click) btn.pressed.connect(on_press) btn.released.connect(on_release) # Show the window and run the app w.show() app.exec_() |
Qt4 window
In this tutorial you will learn how to create a graphical hello world application with PyQT4.
PyQT4, it is one of Pythons options for graphical user interface (GUI) programming.
Related course:
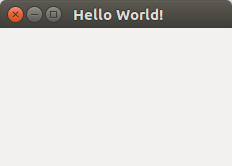
PyQt4 window example:
This application will create a graphical window that can be minimized, maximimzed and resized it.
#! /usr/bin/env python # -*- coding: utf-8 -*- # import sys from PyQt4.QtGui import * # Create an PyQT4 application object. a = QApplication(sys.argv) # The QWidget widget is the base class of all user interface objects in PyQt4. w = QWidget() # Set window size. w.resize(320, 240) # Set window title w.setWindowTitle("Hello World!") # Show window w.show() sys.exit(a.exec_()) |
The PyQT4 module must be immported, we do that with this line:
from PyQt4.QtGui import * |
We create the PyQT4 application object using QApplication():
a = QApplication(sys.argv) |
We create the window (QWidget), resize, set the tittle and show it with this code:
w = QWidget() w.resize(320, 240) w.setWindowTitle("Hello World!") |
Don’t forget to show the window:
# Show window w.show() |
You can download a collection of PyQt4 examples:
Download PyQT Code (Bulk Collection)
QT4 Messagebox
PyQT4 offers message box functionality using several functions.
Messageboxes included in PyQT4 are: question, warning, error, information, criticial and about box.
Related course:
PyQt4 mesagebox
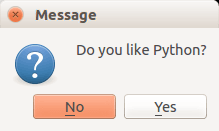
The code below will display a message box with two buttons:
#! /usr/bin/env python # -*- coding: utf-8 -*- # import sys from PyQt4.QtGui import * # Create an PyQT4 application object. a = QApplication(sys.argv) # The QWidget widget is the base class of all user interface objects in PyQt4. w = QWidget() # Show a message box result = QMessageBox.question(w, 'Message', "Do you like Python?", QMessageBox.Yes | QMessageBox.No, QMessageBox.No) if result == QMessageBox.Yes: print 'Yes.' else: print 'No.' # Show window w.show() sys.exit(a.exec_()) |
Result:
There are different types of messageboxes that PyQT4 provides.
PyQT4 Warning Box
You can display a warning box using this line of code:
QMessageBox.warning(w, "Message", "Are you sure you want to continue?") |
PyQT4 Information box
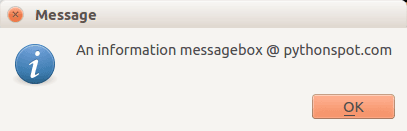
We can display an information box using QMessageBox.information()
QMessageBox.information(w, "Message", "An information messagebox @ pythonspot.com ") |
Result:
PyQT4 Critical Box
If something goes wrong in your application you may want to display an error message.
QMessageBox.critical(w, "Message", "No disk space left on device.") |
Result:

PyQT4 About box
We have shown the question box above.
QMessageBox.about(w, "About", "An example messagebox @ pythonspot.com ") |
Result:
Matplotlib scatterplot
Matplot has a built-in function to create scatterplots called scatter(). A scatter plot is a type of plot that shows the data as a collection of points. The position of a point depends on its two-dimensional value, where each value is a position on either the horizontal or vertical dimension.
Related course
Scatterplot example
Example:
import numpy as np import matplotlib.pyplot as plt # Create data N = 500 x = np.random.rand(N) y = np.random.rand(N) colors = (0,0,0) area = np.pi*3 # Plot plt.scatter(x, y, s=area, c=colors, alpha=0.5) plt.title('Scatter plot pythonspot.com') plt.xlabel('x') plt.ylabel('y') plt.show() |

Scatter plot with groups
Data can be classified in several groups. The code below demonstrates that:
import numpy as np import matplotlib.pyplot as plt # Create data N = 60 g1 = (0.6 + 0.6 * np.random.rand(N), np.random.rand(N)) g2 = (0.4+0.3 * np.random.rand(N), 0.5*np.random.rand(N)) g3 = (0.3*np.random.rand(N),0.3*np.random.rand(N)) data = (g1, g2, g3) colors = ("red", "green", "blue") groups = ("coffee", "tea", "water") # Create plot fig = plt.figure() ax = fig.add_subplot(1, 1, 1, axisbg="1.0") for data, color, group in zip(data, colors, groups): x, y = data ax.scatter(x, y, alpha=0.8, c=color, edgecolors='none', s=30, label=group) plt.title('Matplot scatter plot') plt.legend(loc=2) plt.show() |

3d scatterplot
Matplotlib can create 3d plots. Making a 3D scatterplot is very similar to creating a 2d, only some minor differences. On some occasions, a 3d scatter plot may be a better data visualization than a 2d plot. To create 3d plots, we need to import axes3d.
Related course:
Data Visualization with Python and Matplotlib
Introduction
It is required to import axes3d:
from mpl_toolkits.mplot3d import axes3d |
Give the data a z-axis and set the figure to 3d projection:
ax = fig.gca(projection='3d') |

3d scatterplot
Complete 3d scatterplot example below:
import numpy as np import matplotlib.pyplot as plt from mpl_toolkits.mplot3d import axes3d # Create data N = 60 g1 = (0.6 + 0.6 * np.random.rand(N), np.random.rand(N),0.4+0.1*np.random.rand(N)) g2 = (0.4+0.3 * np.random.rand(N), 0.5*np.random.rand(N),0.1*np.random.rand(N)) g3 = (0.3*np.random.rand(N),0.3*np.random.rand(N),0.3*np.random.rand(N)) data = (g1, g2, g3) colors = ("red", "green", "blue") groups = ("coffee", "tea", "water") # Create plot fig = plt.figure() ax = fig.add_subplot(1, 1, 1, axisbg="1.0") ax = fig.gca(projection='3d') for data, color, group in zip(data, colors, groups): x, y, z = data ax.scatter(x, y, z, alpha=0.8, c=color, edgecolors='none', s=30, label=group) plt.title('Matplot 3d scatter plot') plt.legend(loc=2) plt.show() |
The plot is created using several steps:
- vector creation (g1,g2,g3)
- list creation (groups)
- plotting
The final plot is shown with plt.show()
Matplotlib Subplot
The Matplotlib subplot() function can be called to plot two or more plots in one figure. Matplotlib supports all kind of subplots including 2×1 vertical, 2×1 horizontal or a 2×2 grid.
Related courses
Horizontal subplot
Use the code below to create a horizontal subplot
from pylab import * t = arange(0.0, 20.0, 1) s = [1,2,3,4,5,6,7,8,9,10,11,12,13,14,15,16,17,18,19,20] subplot(2,1,1) xticks([]), yticks([]) title('subplot(2,1,1)') plot(t,s) subplot(2,1,2) xticks([]), yticks([]) title('subplot(2,1,2)') plot(t,s,'r-') show() |

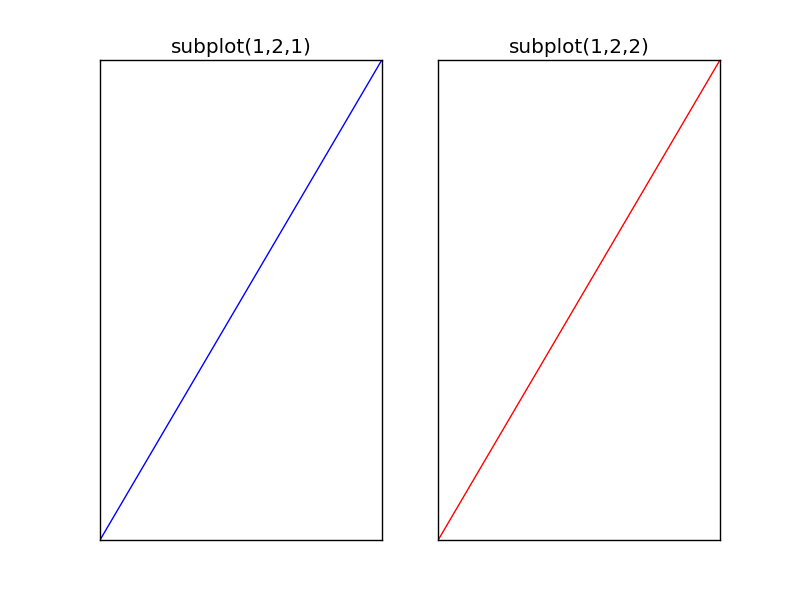
Vertical subplot
By changing the subplot parameters we can create a vertical plot
from pylab import * t = arange(0.0, 20.0, 1) s = [1,2,3,4,5,6,7,8,9,10,11,12,13,14,15,16,17,18,19,20] subplot(1,2,1) xticks([]), yticks([]) title('subplot(1,2,1)') plot(t,s) subplot(1,2,2) xticks([]), yticks([]) title('subplot(1,2,2)') plot(t,s,'r-') show() |
Subplot grid
To create a 2×2 grid of plots, you can use this code:
from pylab import * t = arange(0.0, 20.0, 1) s = [1,2,3,4,5,6,7,8,9,10,11,12,13,14,15,16,17,18,19,20] subplot(2,2,1) xticks([]), yticks([]) title('subplot(2,2,1)') plot(t,s) subplot(2,2,2) xticks([]), yticks([]) title('subplot(2,2,2)') plot(t,s,'r-') subplot(2,2,3) xticks([]), yticks([]) title('subplot(2,2,3)') plot(t,s,'g-') subplot(2,2,4) xticks([]), yticks([]) title('subplot(2,2,4)') plot(t,s,'y-') show() |
