matplotlib update plot
Python hosting: Host, run, and code Python in the cloud!
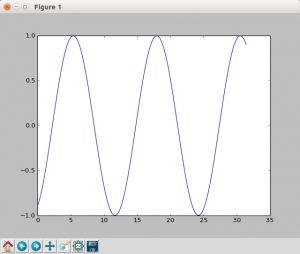
Updating a matplotlib plot is straightforward. Create the data, the plot and update in a loop.
Setting interactive mode on is essential: plt.ion(). This controls if the figure is redrawn every draw() command. If it is False (the default), then the figure does not update itself.
Update plot example
Copy the code below to test an interactive plot.
|

Explanation
We create the data to plot using:
|
Turn on interacive mode using:
|
Configure the plot (the ‘b-‘ indicates a blue line):
|
And finally update in a loop:
|
Posted in plotting

Leave a Reply:
below the last line, you need an extra line: